Quite often architects are challenged with the need to analyze large sets of data in the design process. However, there is a lack of defined approaches and therefore in most cases detailed analyses are avoided. Through this project I tried to observe a fraction of what could be used as a valuable assessment tool in various projects. Clustering approaches are not uncommon in different fields when in need to observe data, but in architecture these have been poorly investigated. I have used the MATLAB programming language developed by MathWorks to investigate the potential for architectural use.
This is a brief description of the steps in the process:
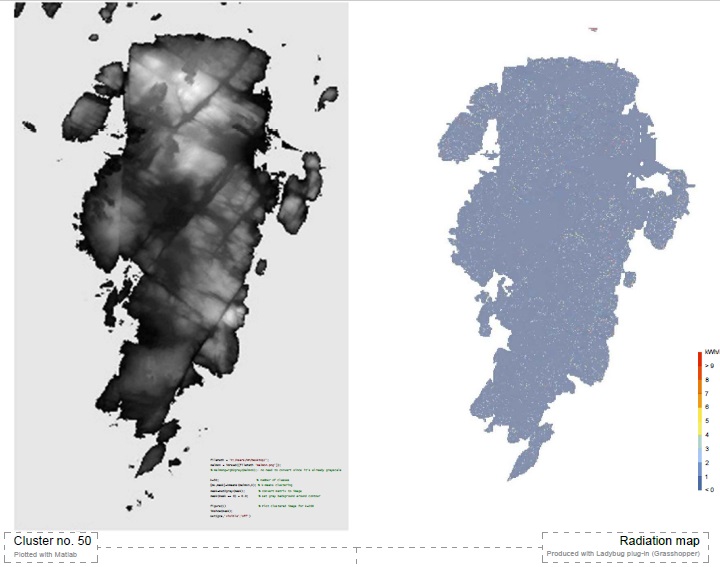
1. Looking at the height maps as a set of pixels containing height data and clustering with kmeans. (This is an unsupervised learning technique that does the analysis without predefined criteria.) The results give groups of heights that share similar ‘intensity’.
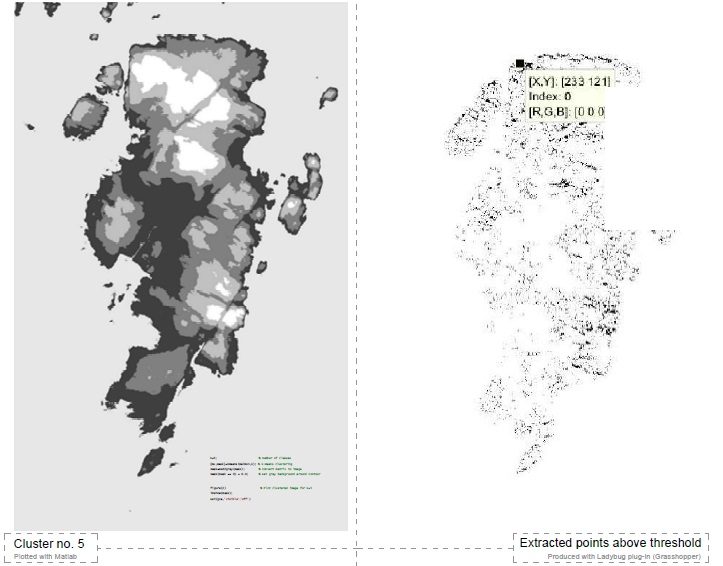
2. A region of interest is selected with clustering division at k=5.
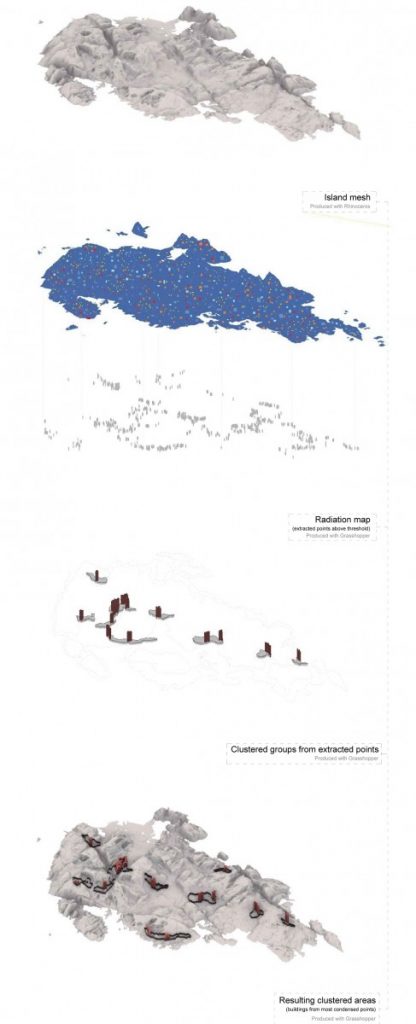
3. Radiation maps of the site are generated using Ladybug. (Different relevant maps or parameters can be used for evaluation depending on the requirements.)
4. k-means clustering is applied on a radiation map. The points that satisfy values above a defined threshold are selected and interpolated to the previously defined region of interest. This gives points that satisfy certain irradiation criteria within the specified height region.
5. New clusters are created in order to define optimal building areas and building shapes are defined at locations where the points satisfy certain density.


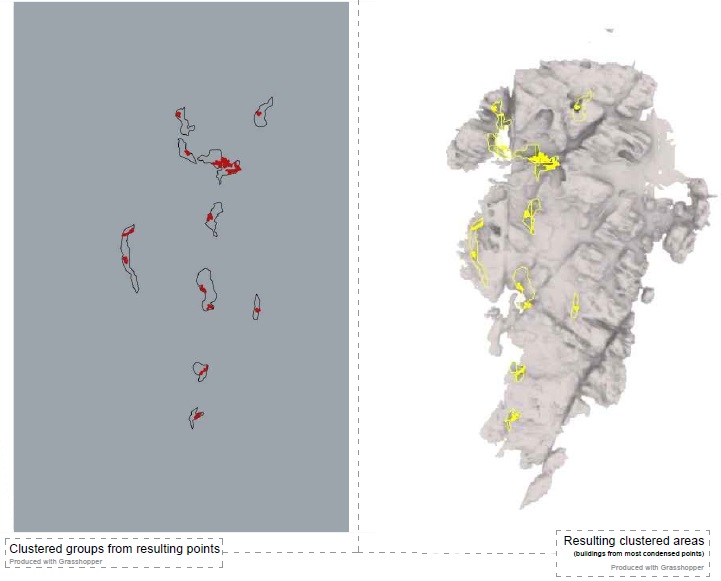
The results from the steps are shown in the following isometric drawing.
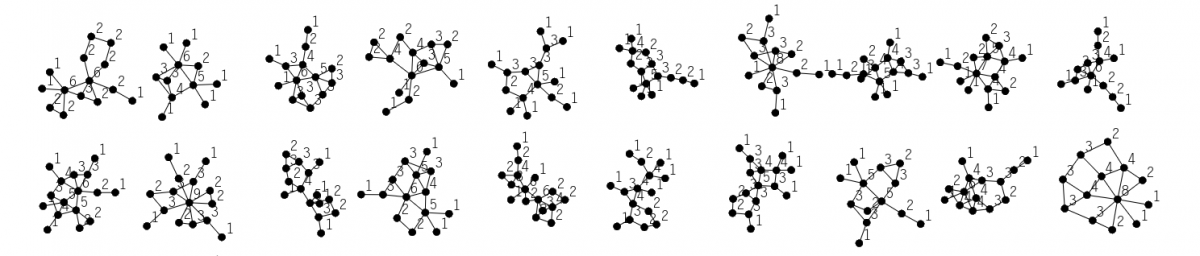
An experiment with varying k-number values in the kmeans clustering was performed and the results can be observed in the short animation. For values above 200 it is difficult to read the information from the resulting images, but lower k-numbers can give different levels of detail depending on the requirements of the user.