Visual ambiguity and perception

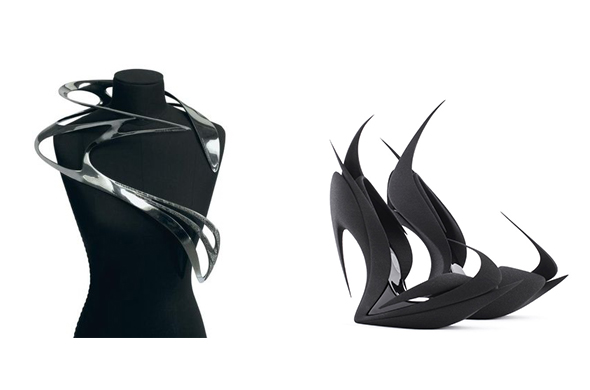
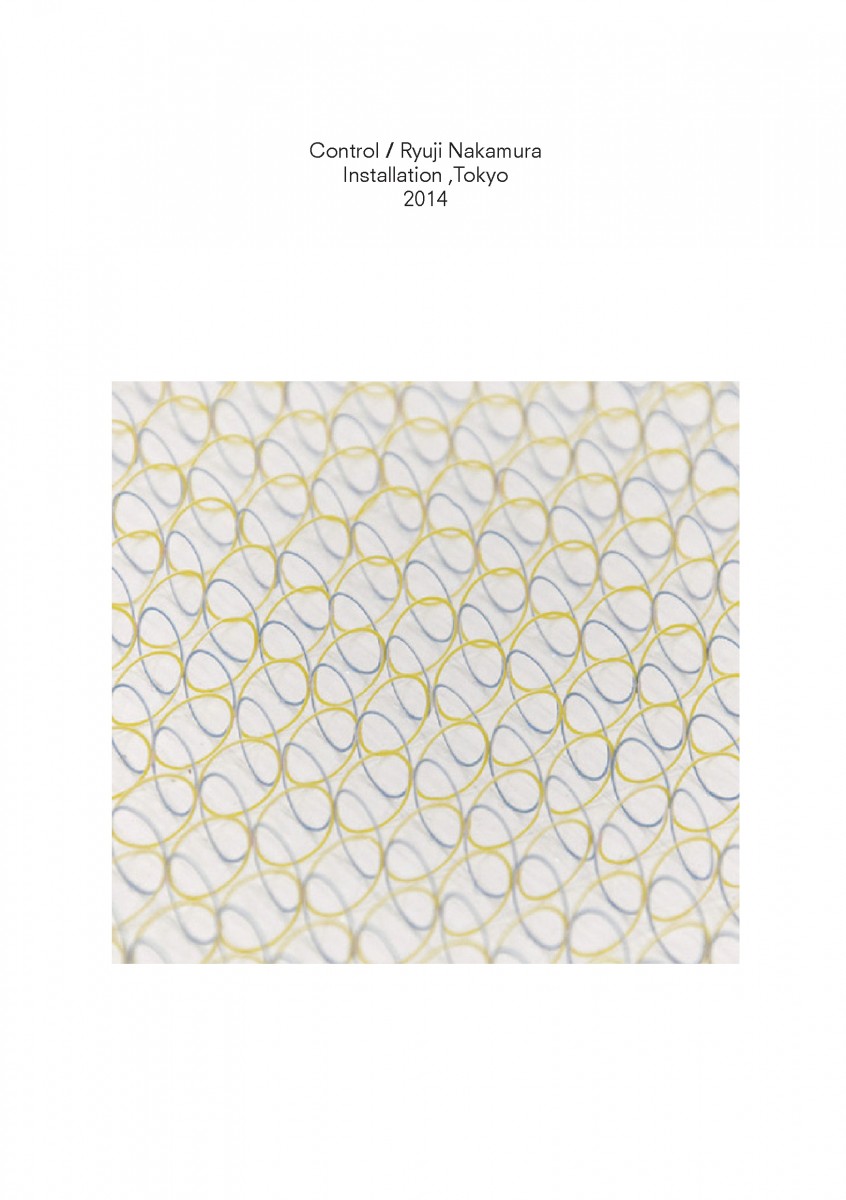
I’ve been exploring the topic by studying overlaps of generated geometry and membrane structures but looking at it as a play between more the rhythmic and ordered rather than organic or natural.

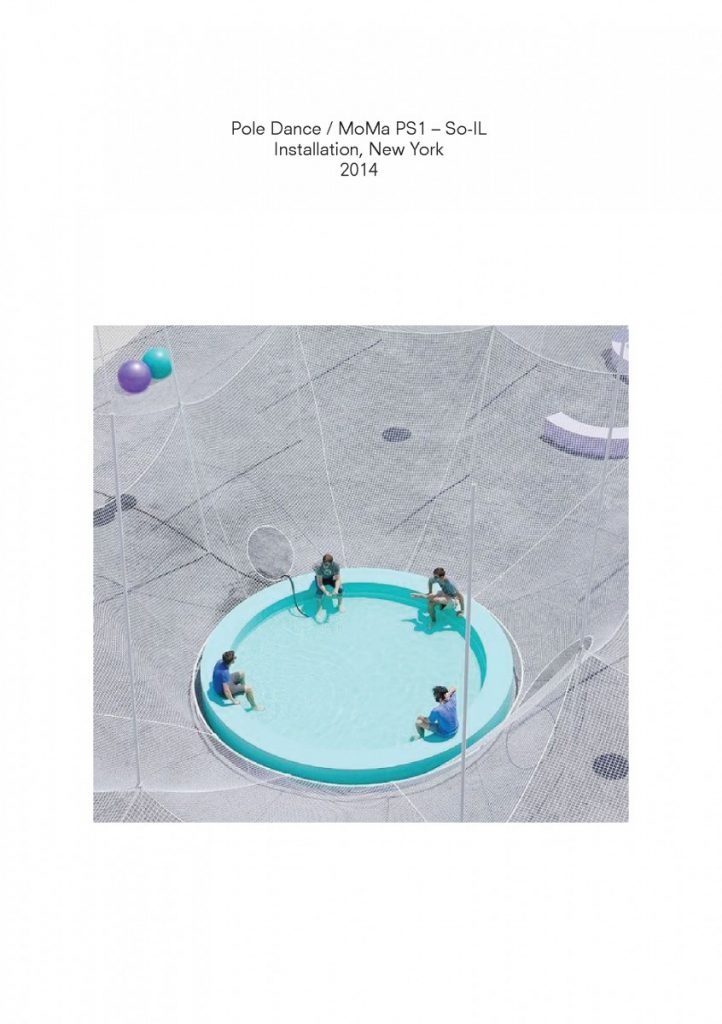
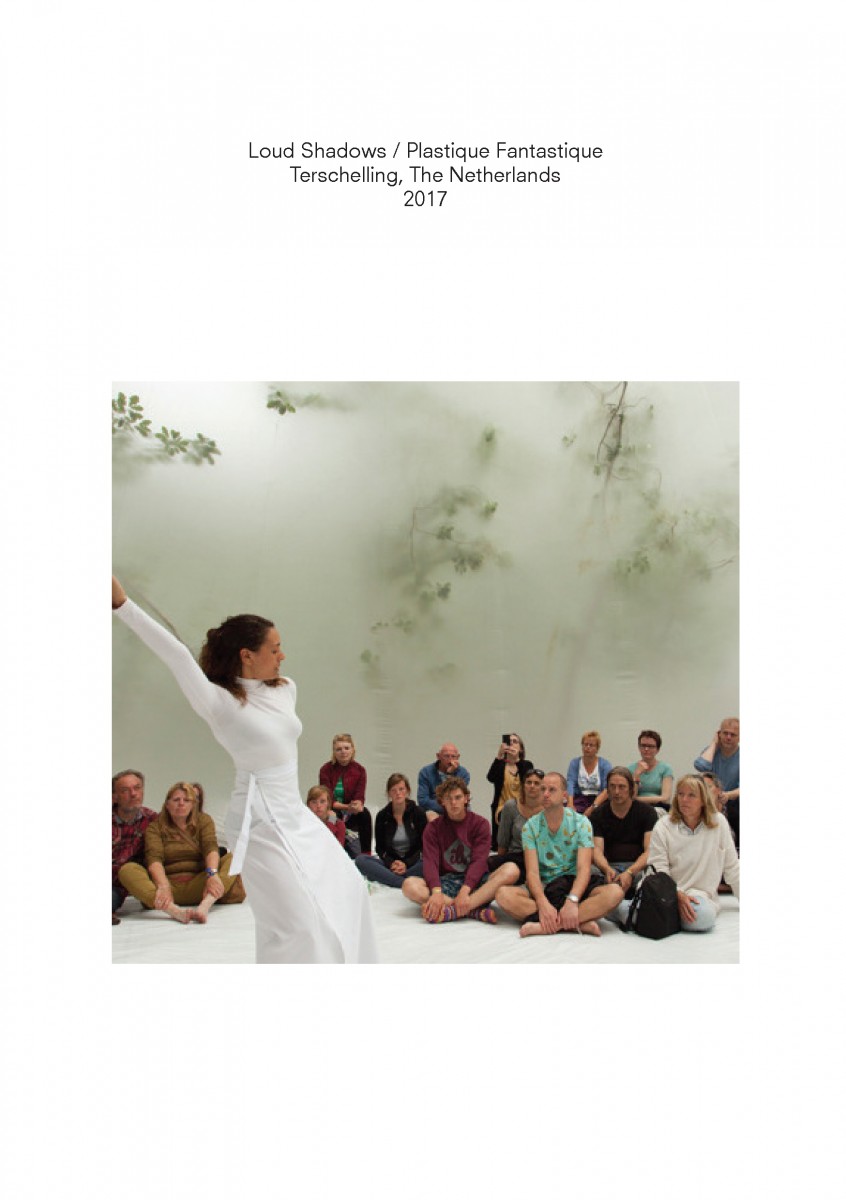
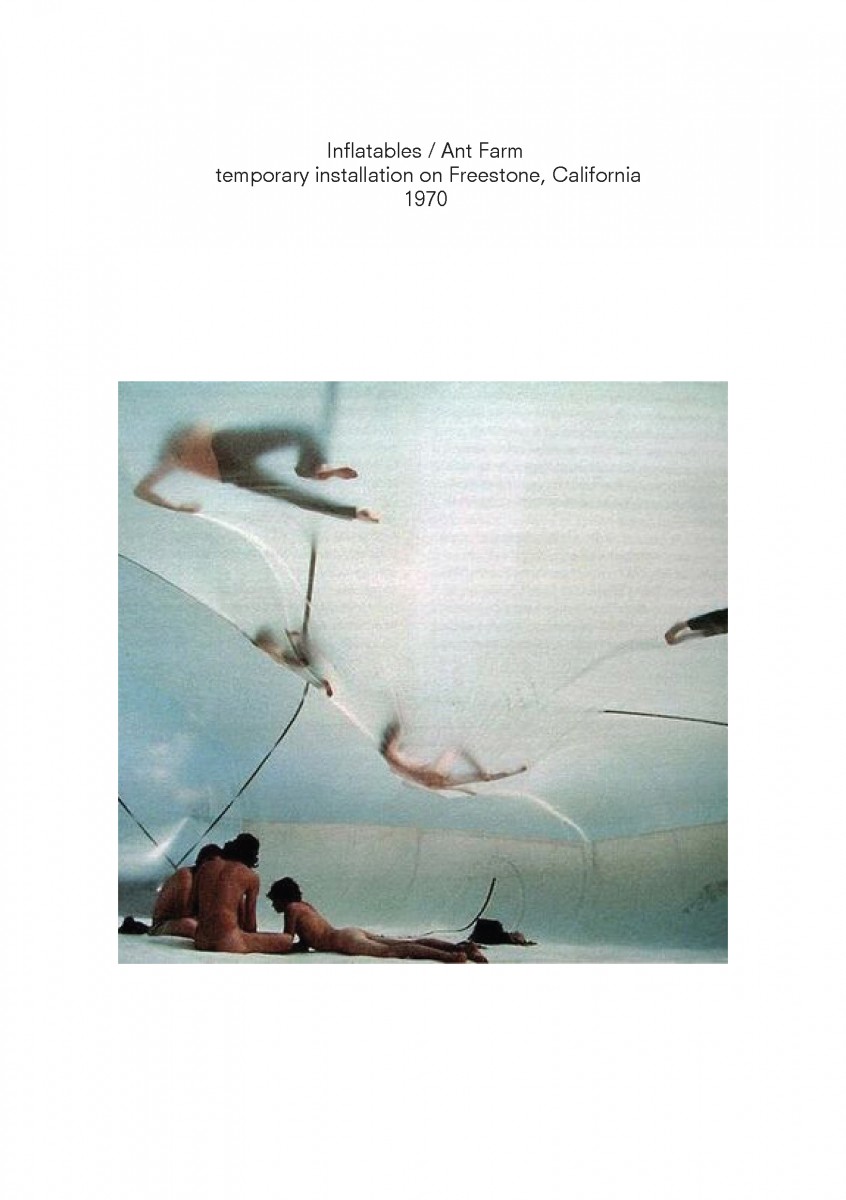
Relevant references:

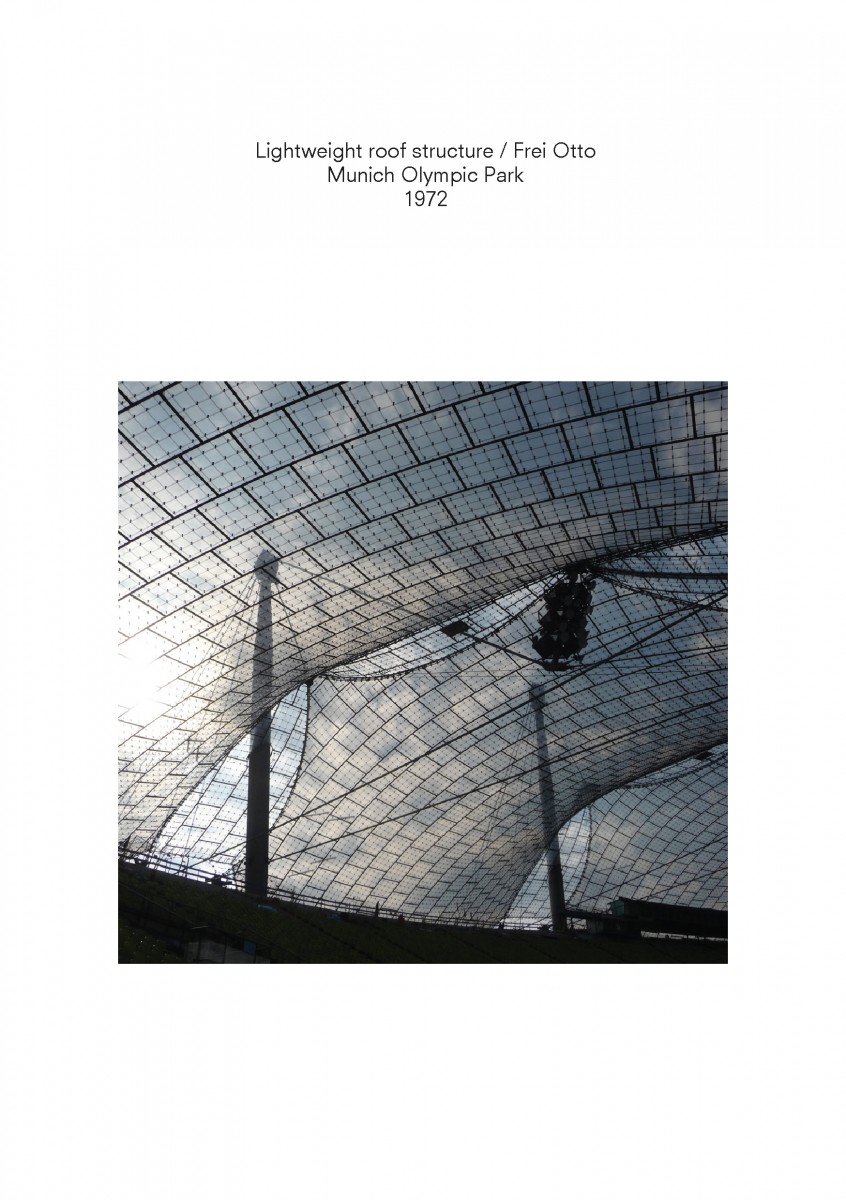
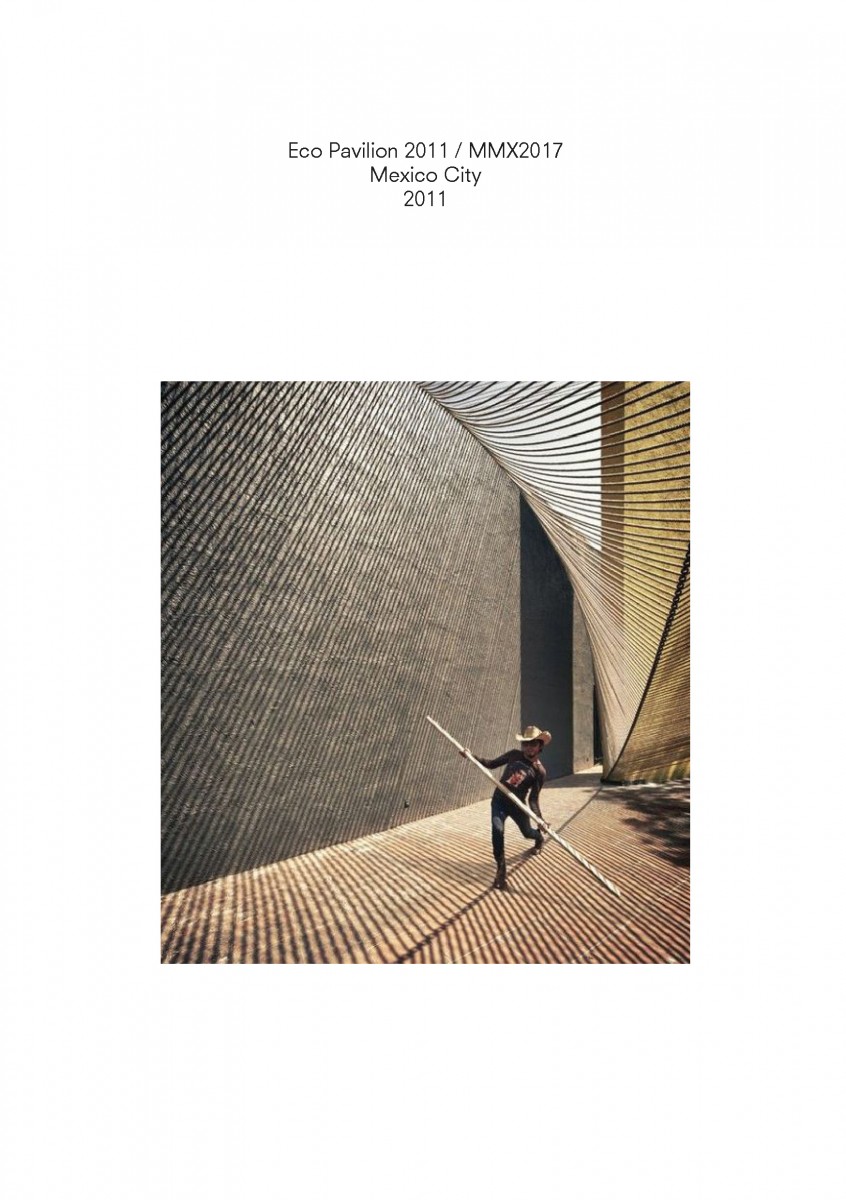
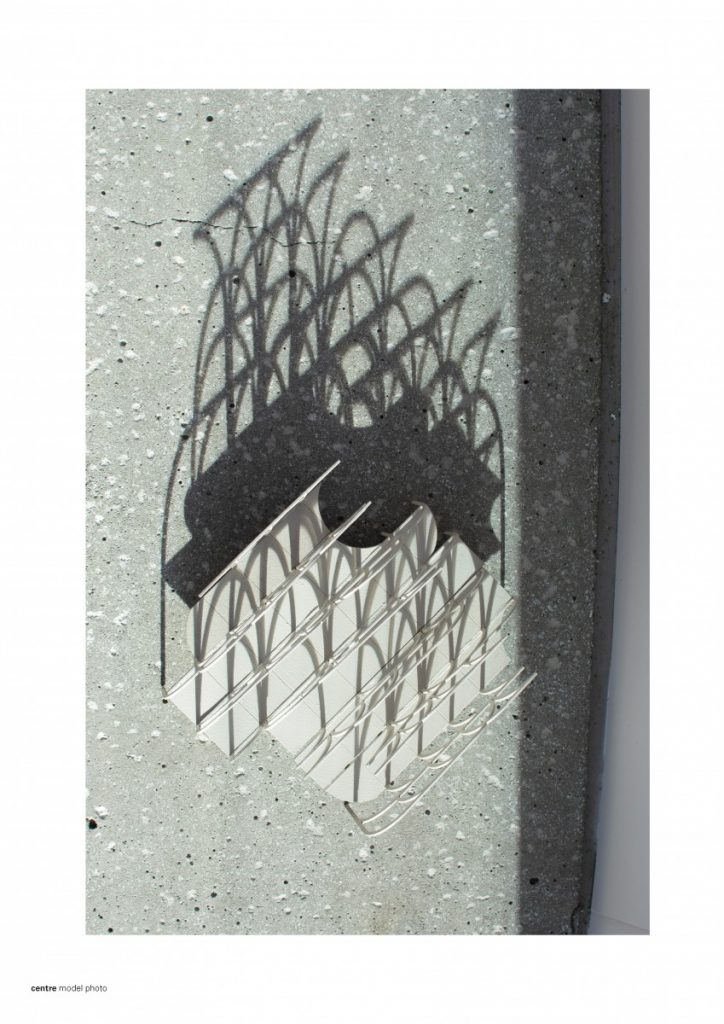
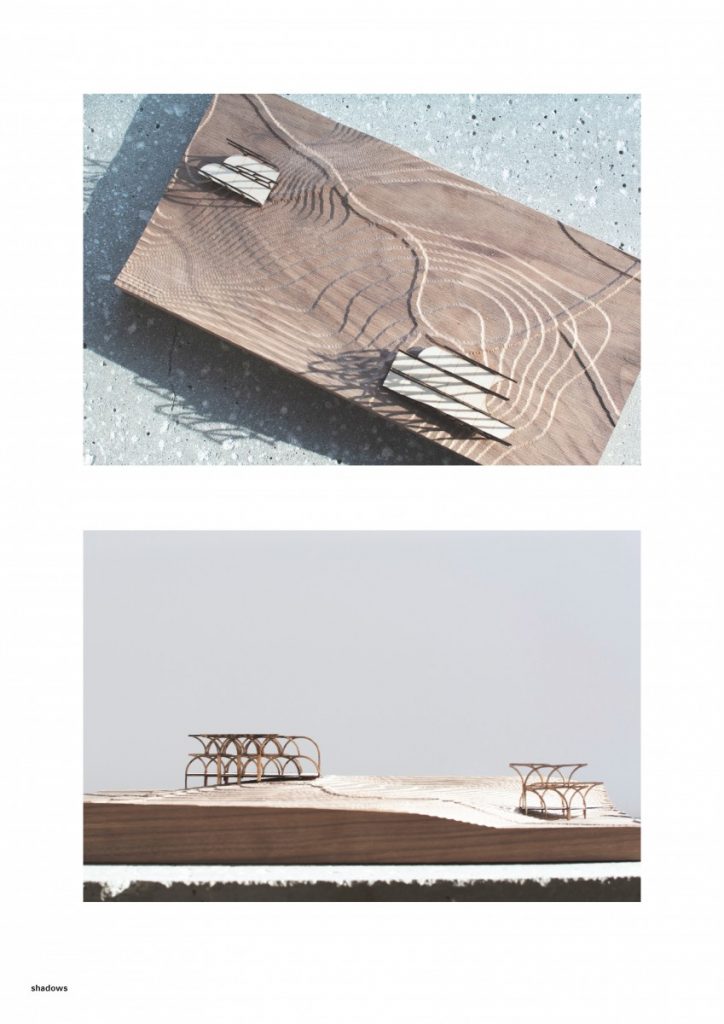
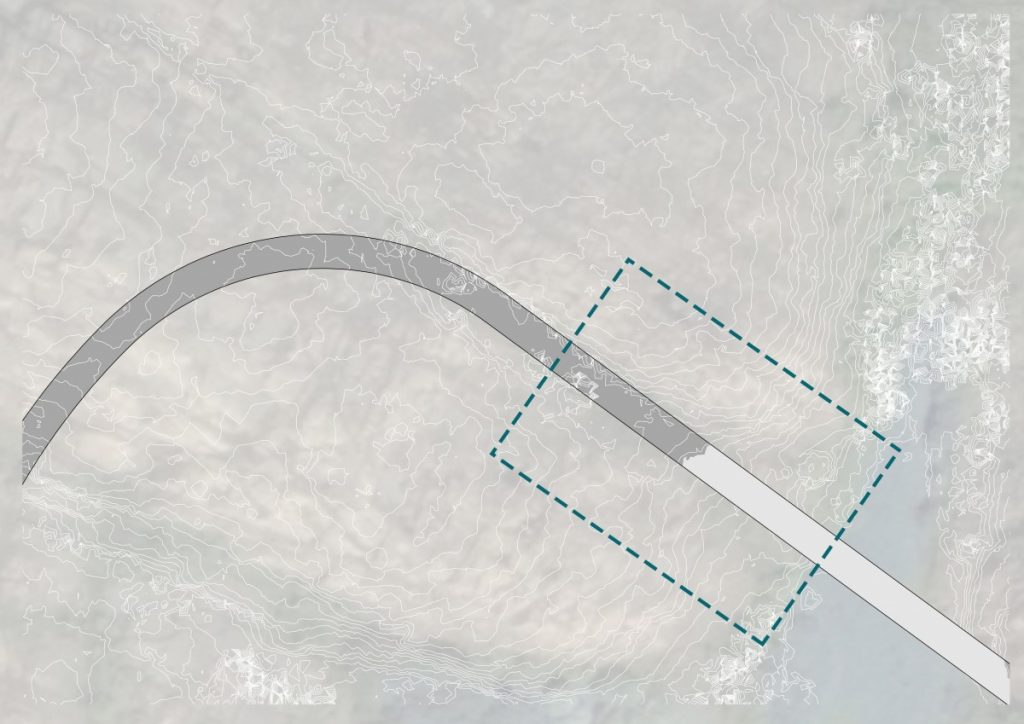
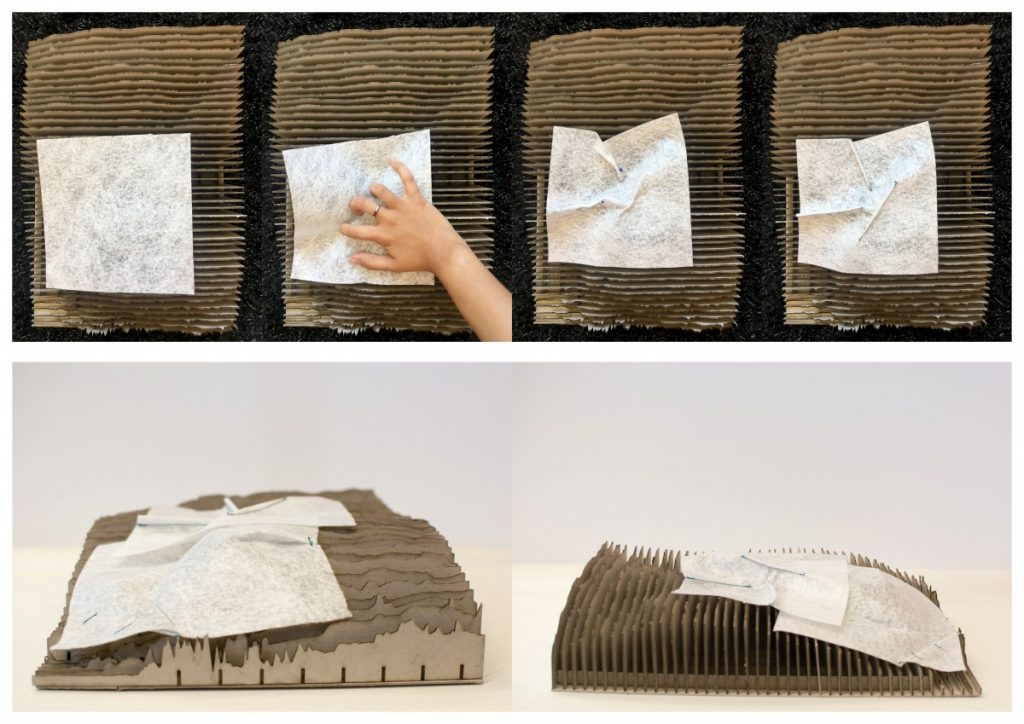
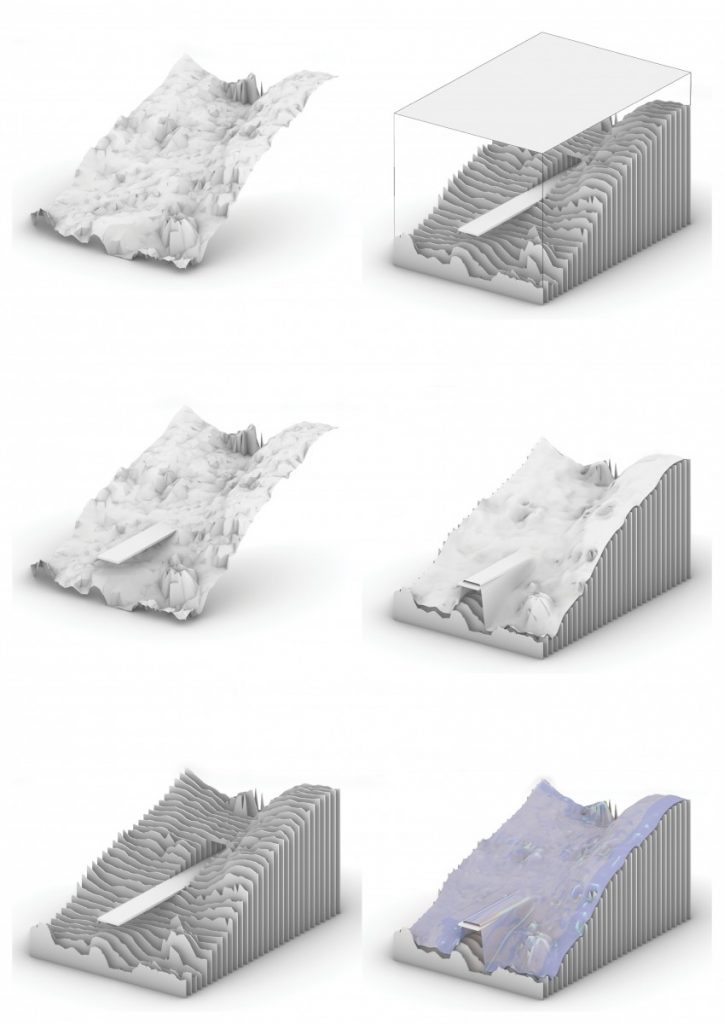
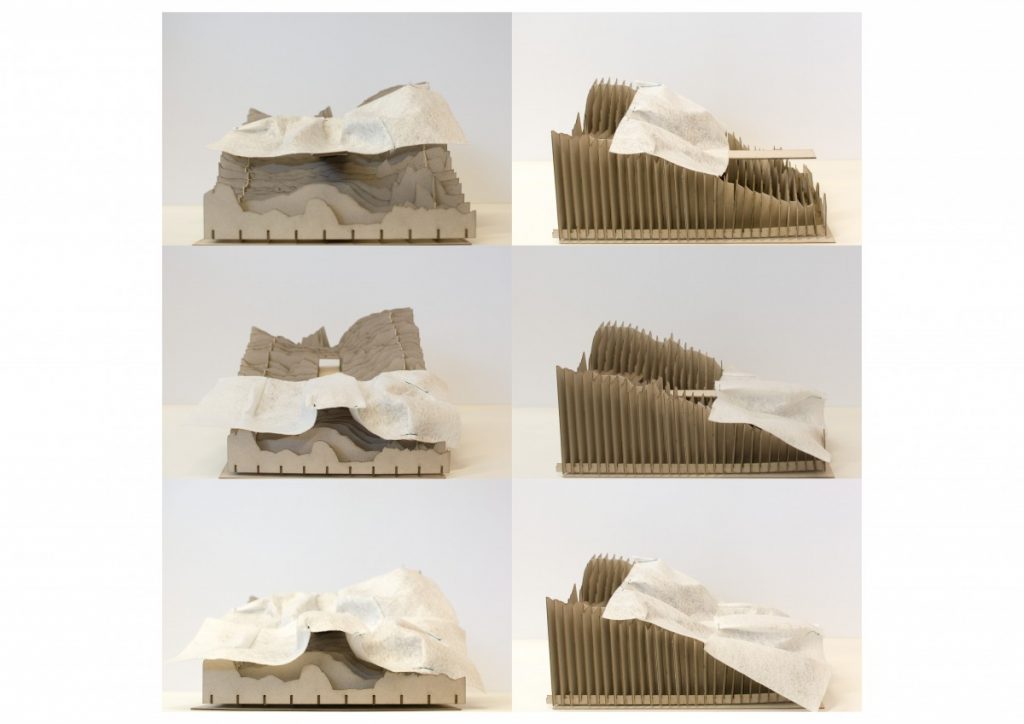
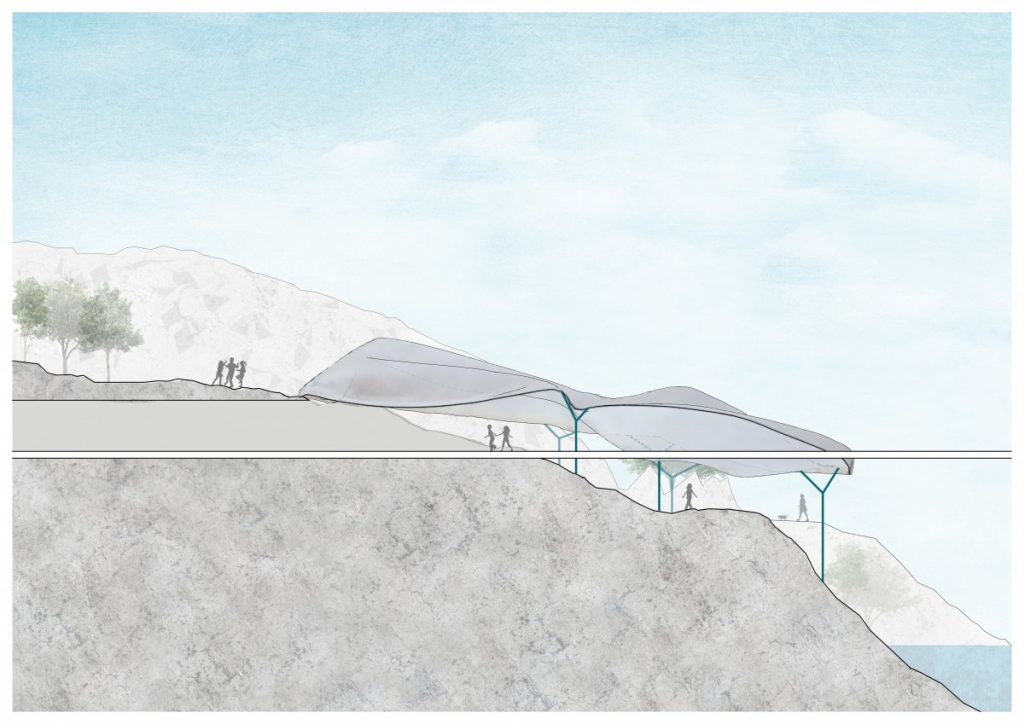
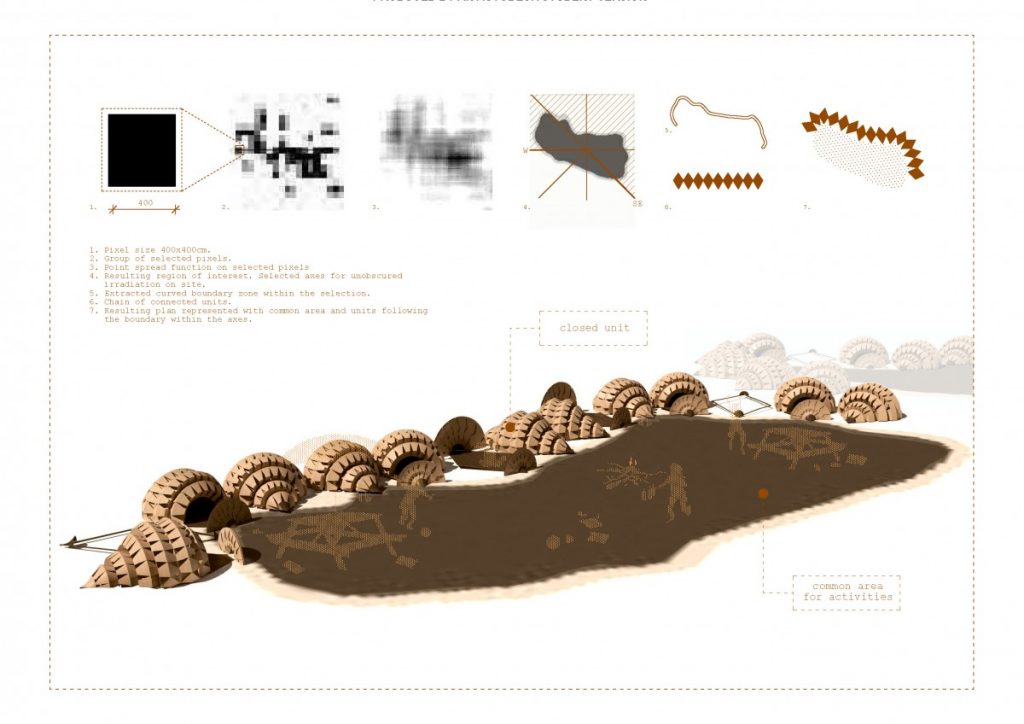
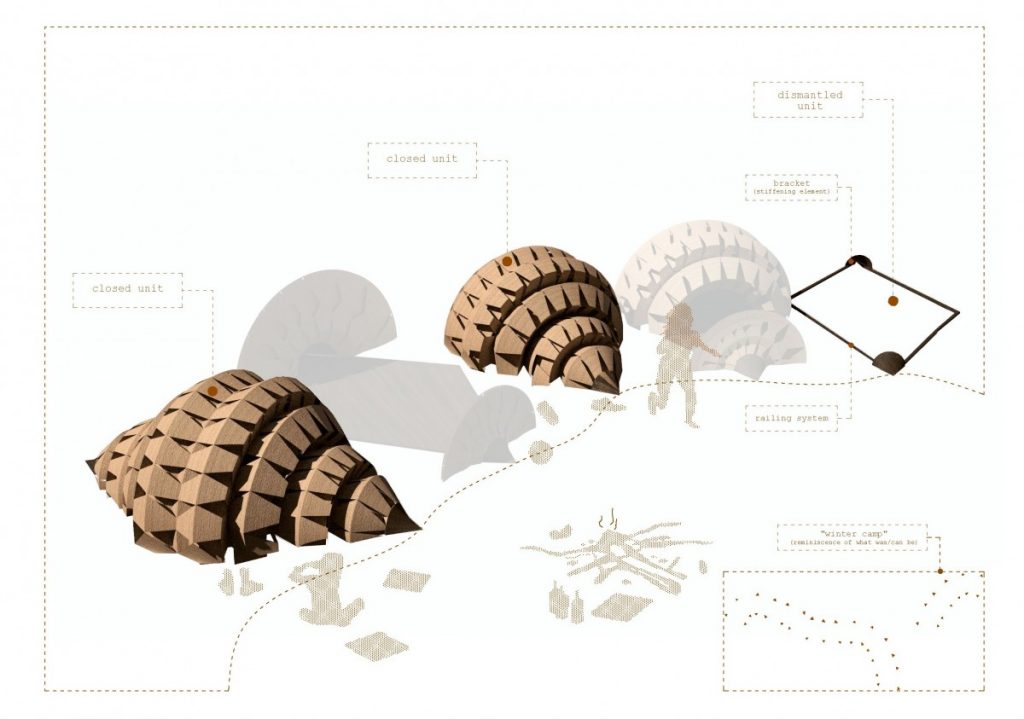
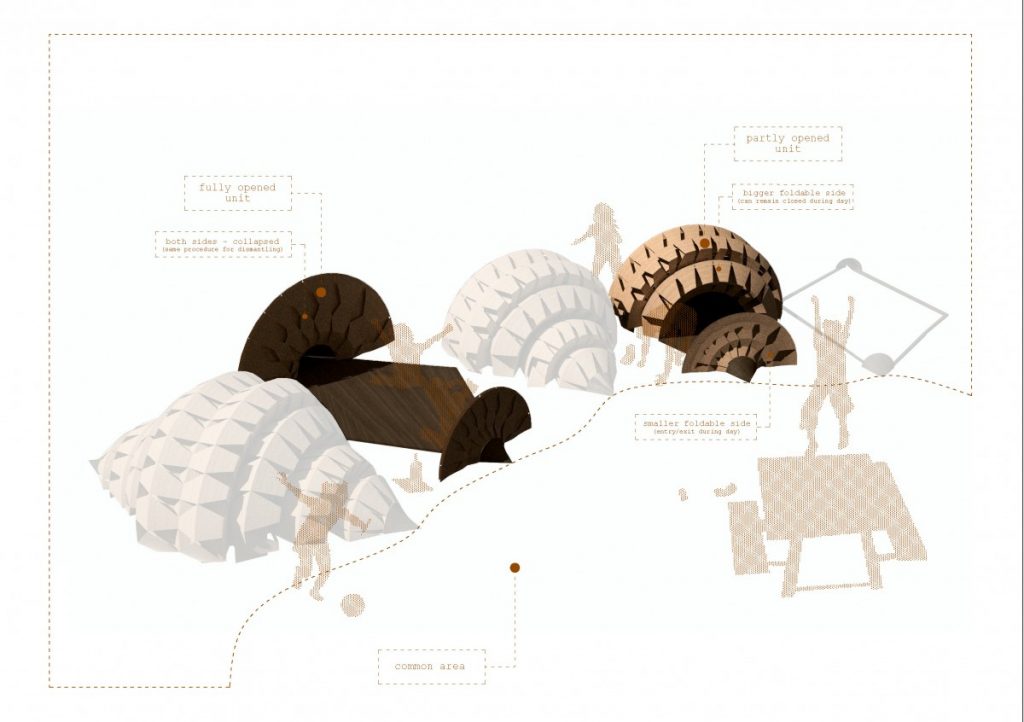
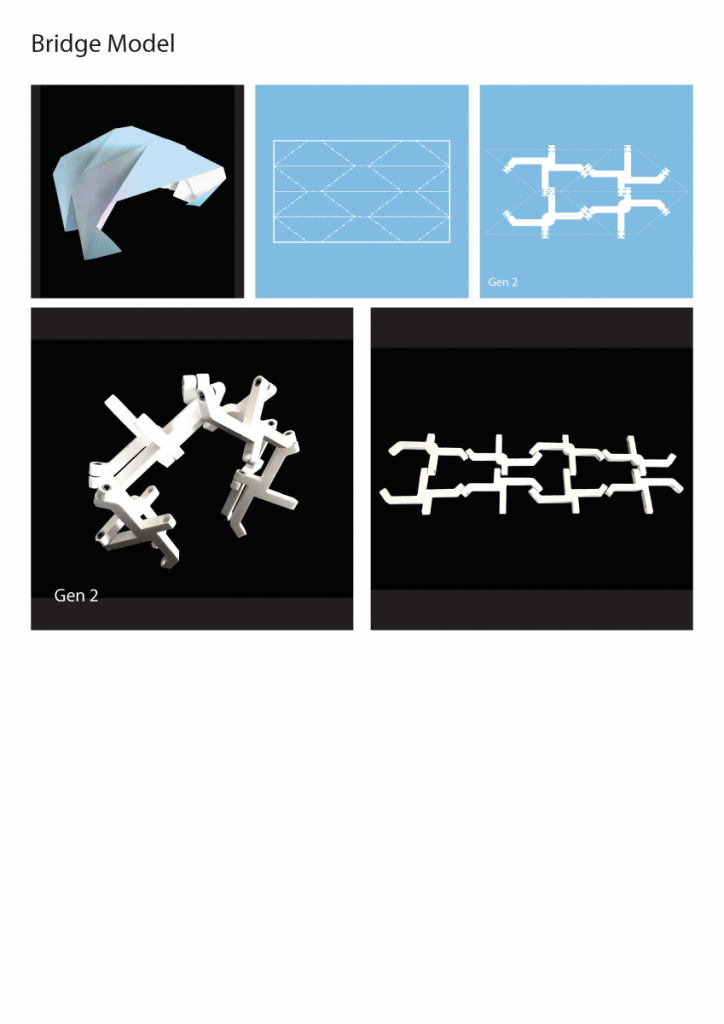
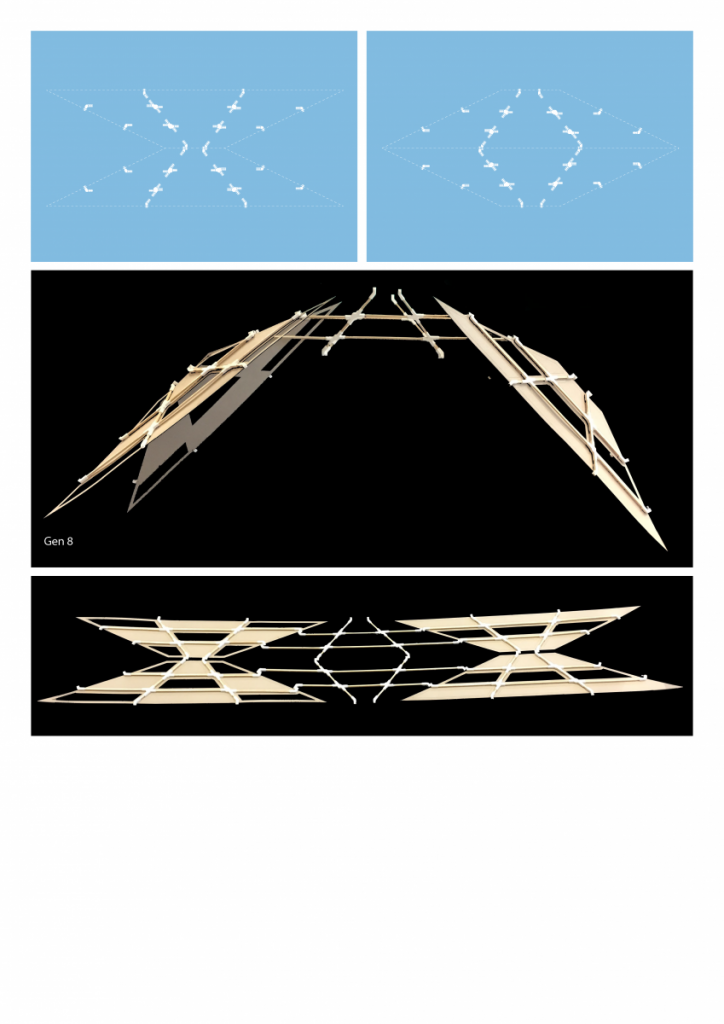
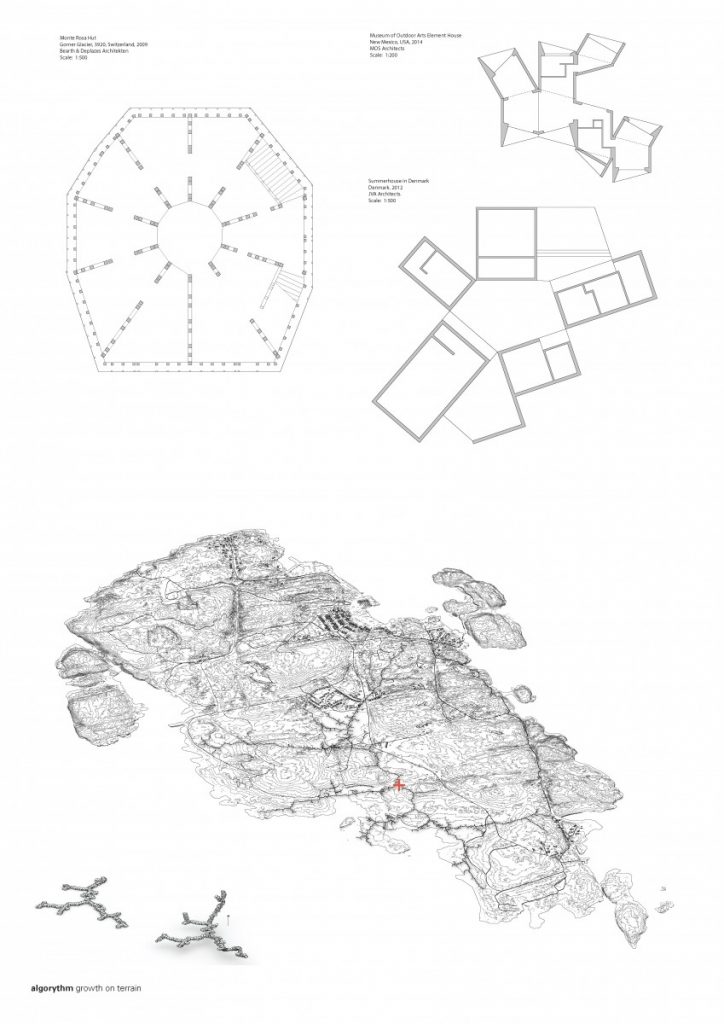
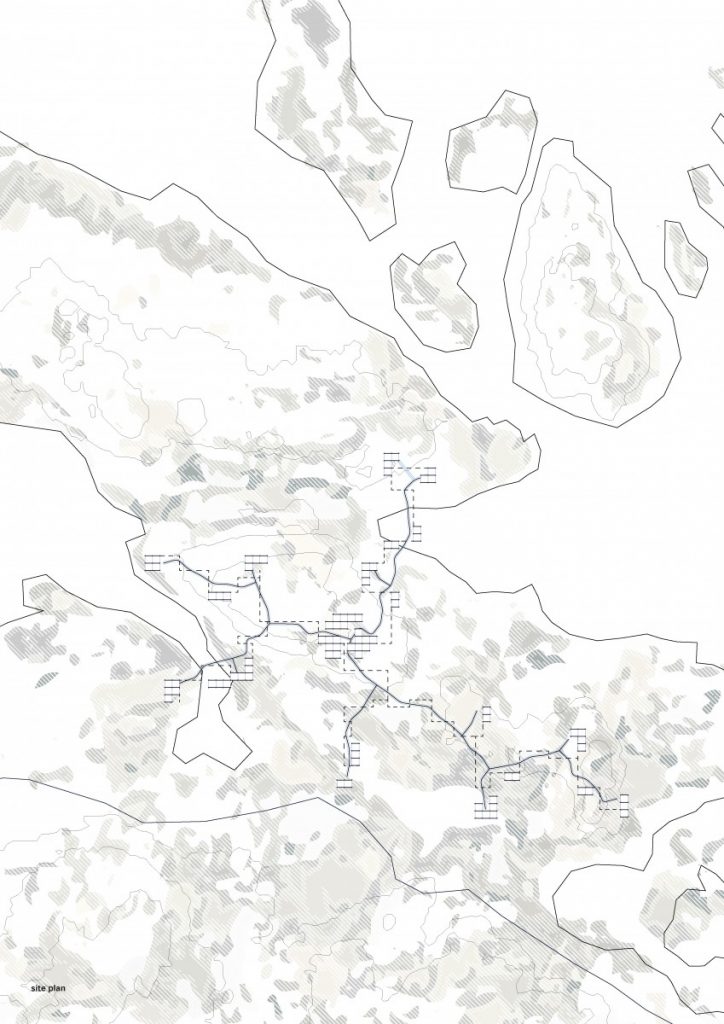
I applied these studies to the configuration we worked out the last part of the semester and created a cloud-like configuration of modular tent-like structures, constructed with frame skeleton.

Site context

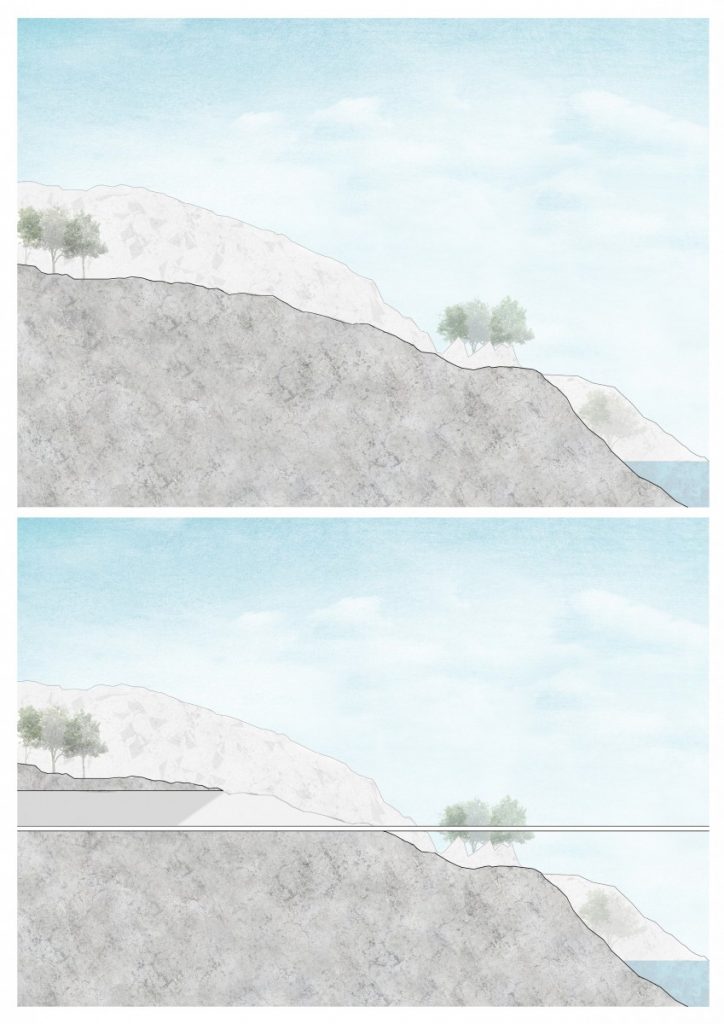
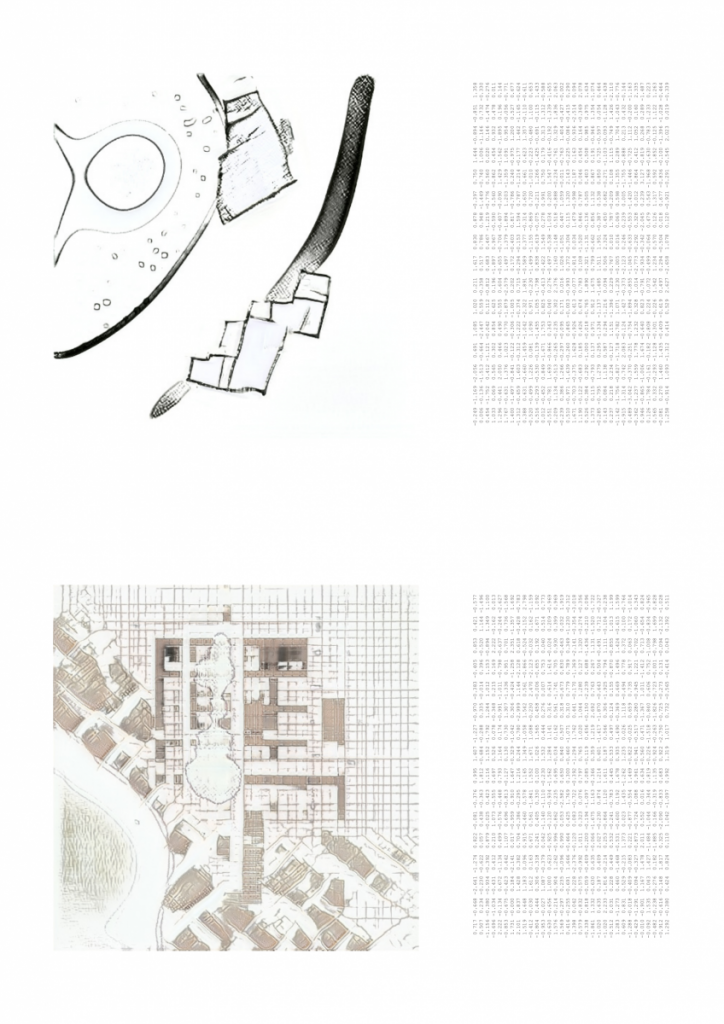
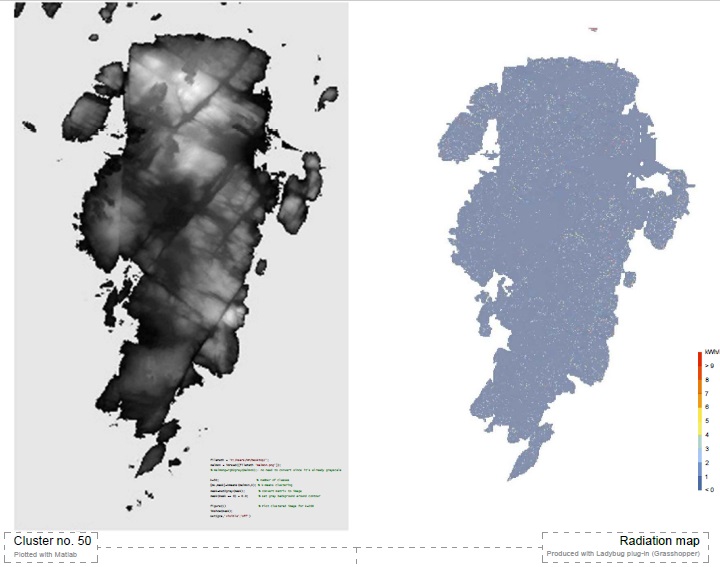
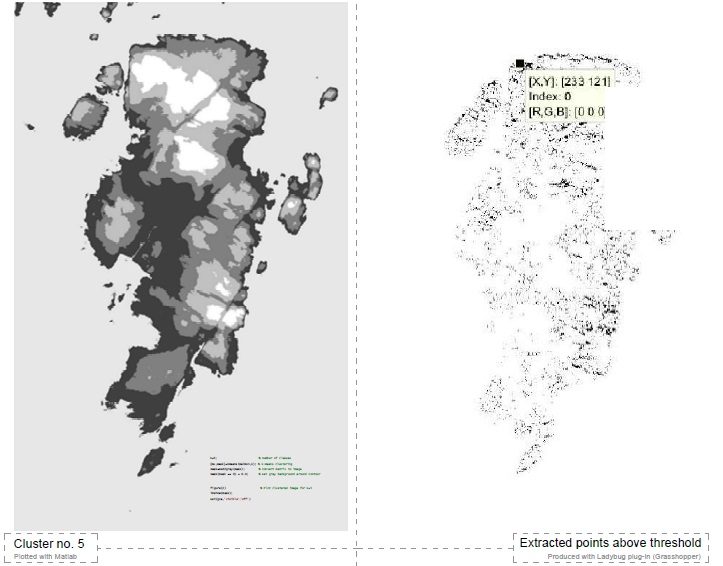
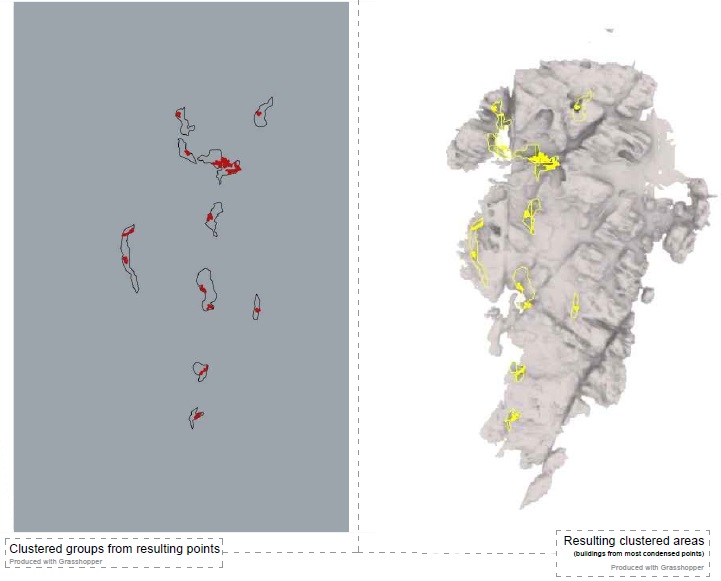
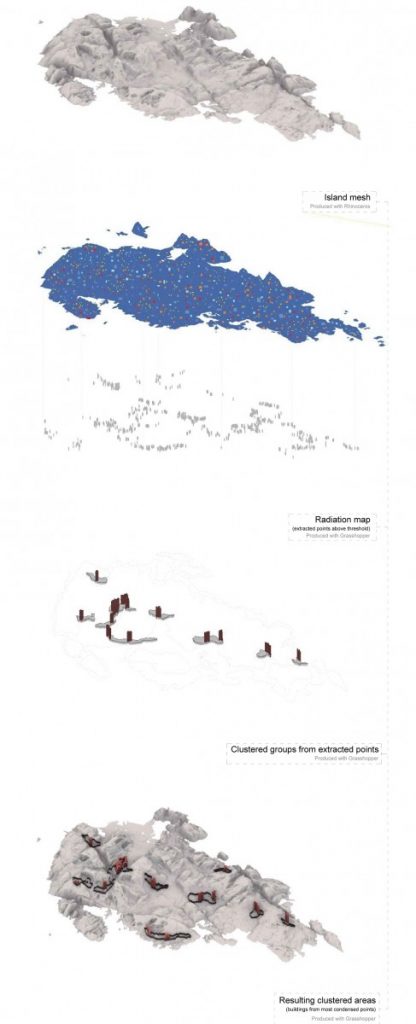
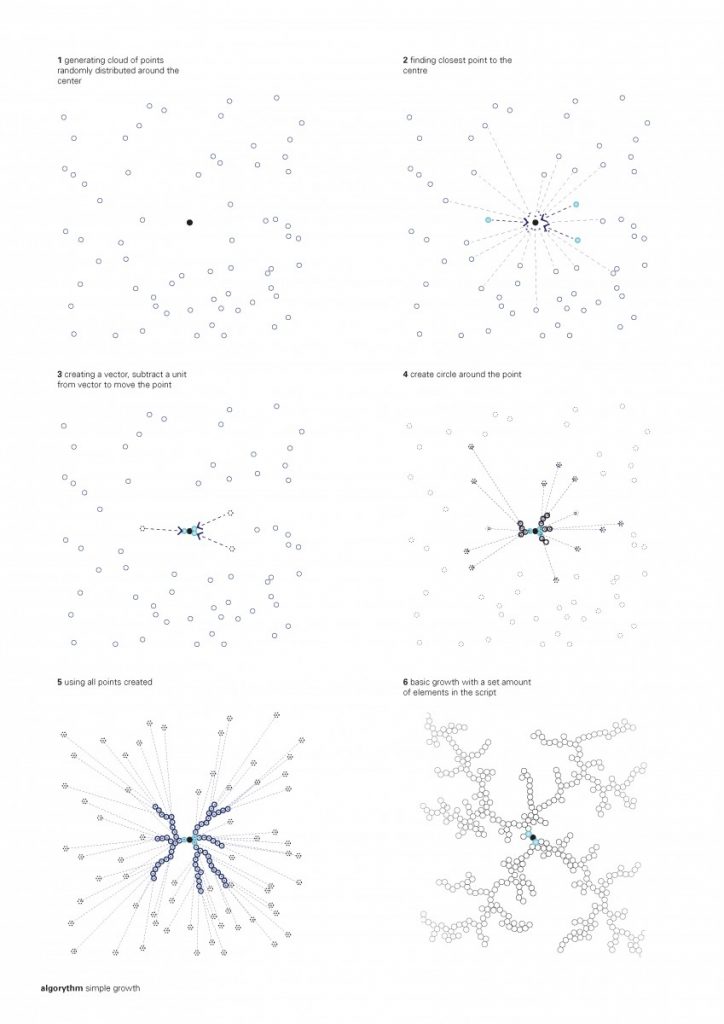
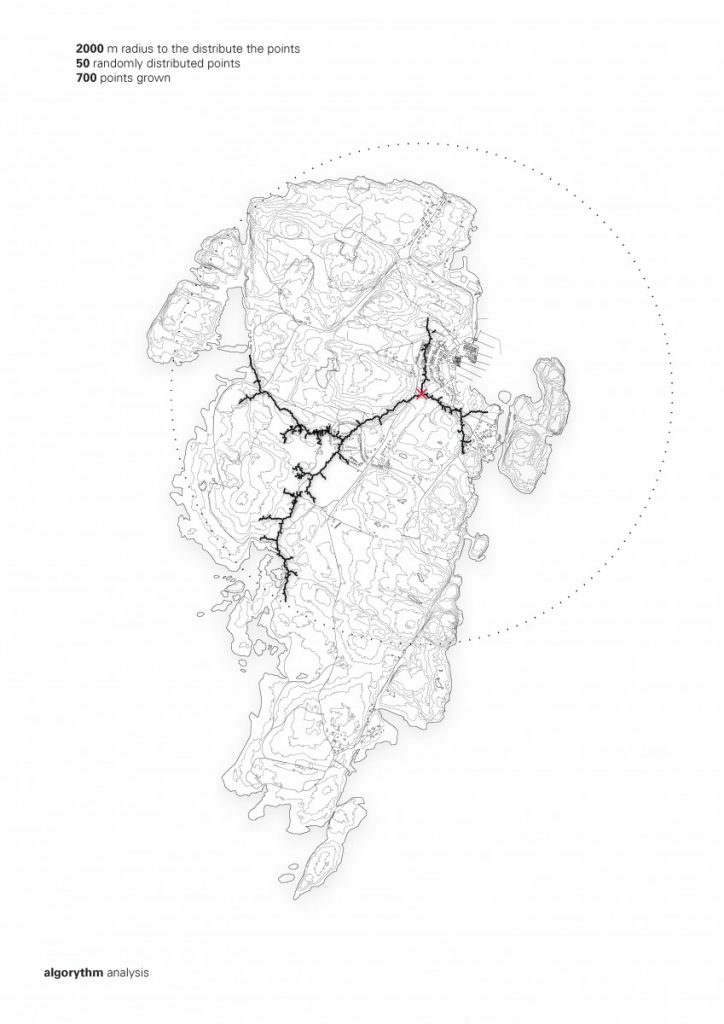
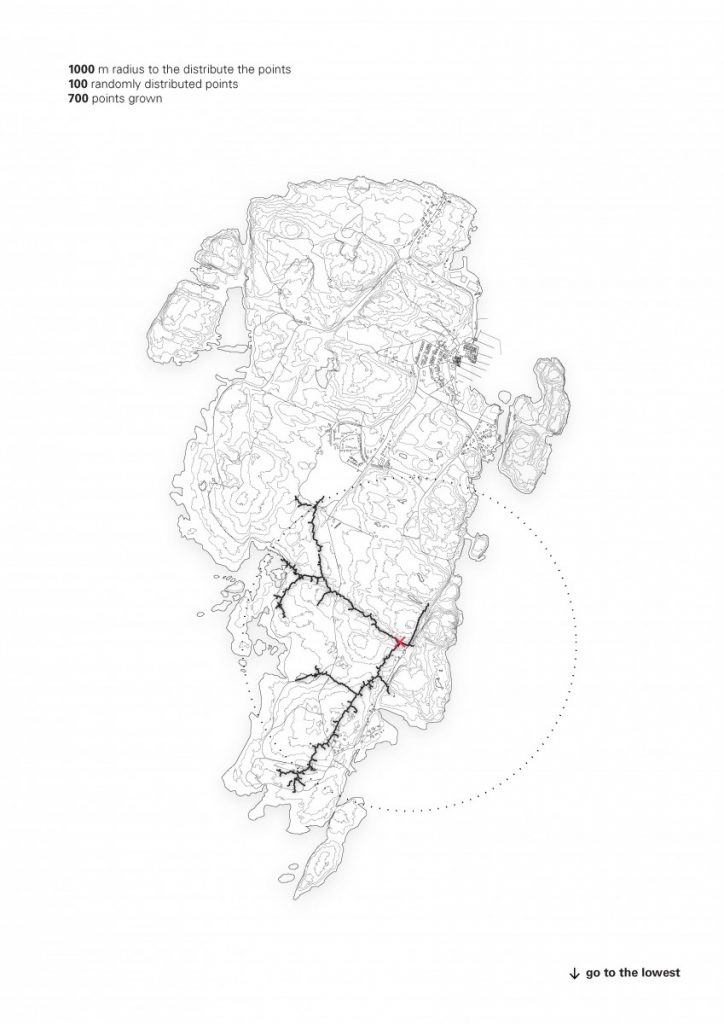
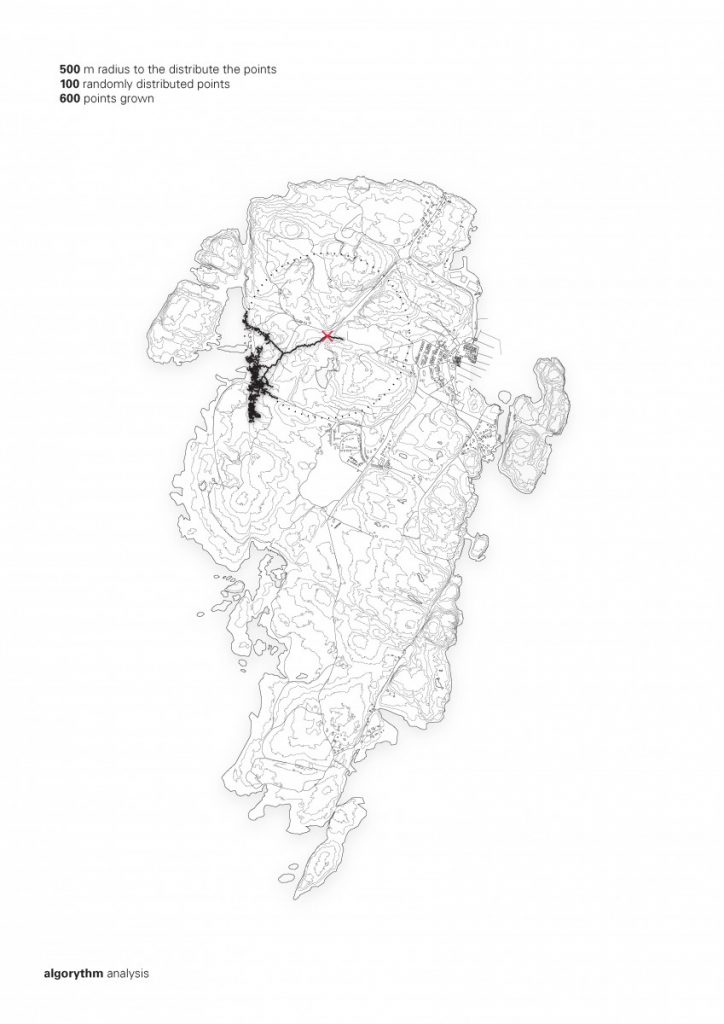
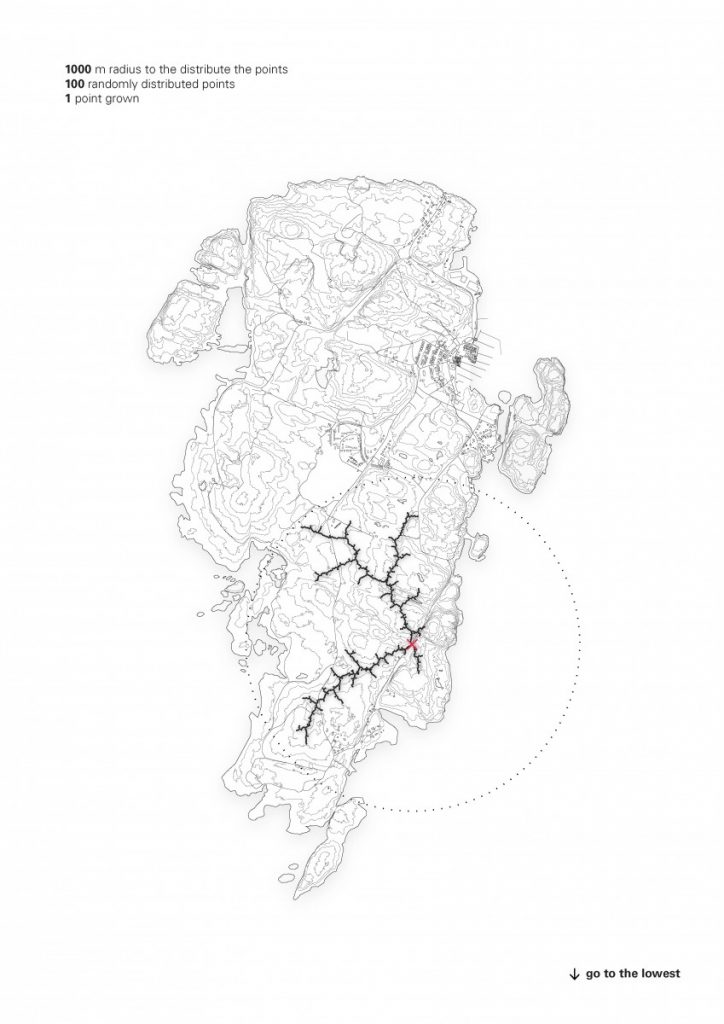
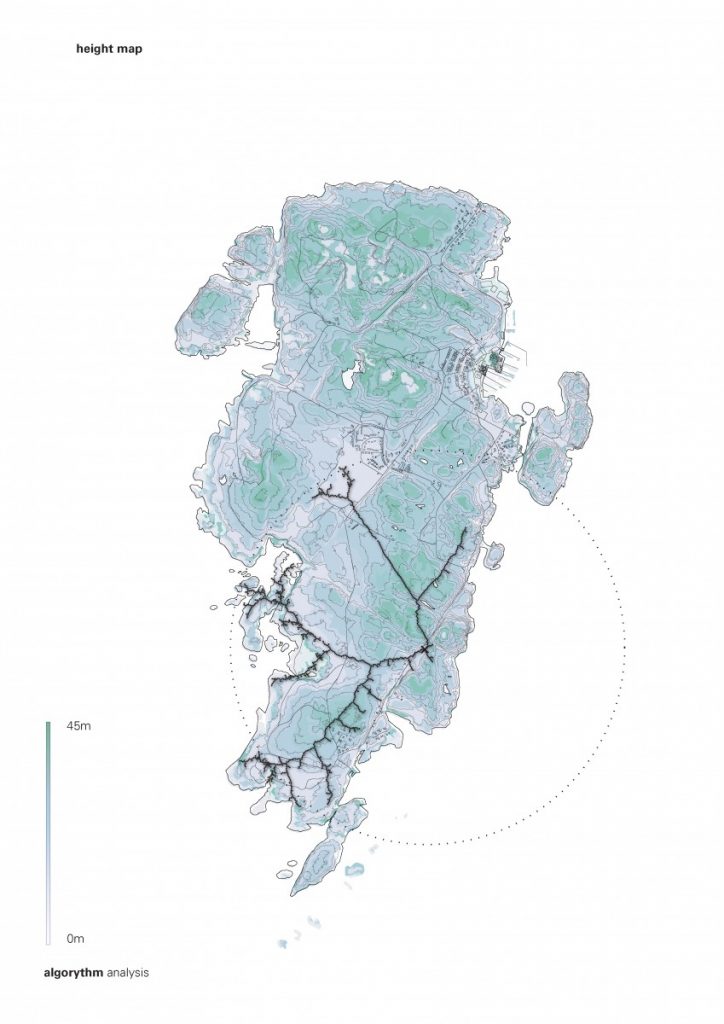
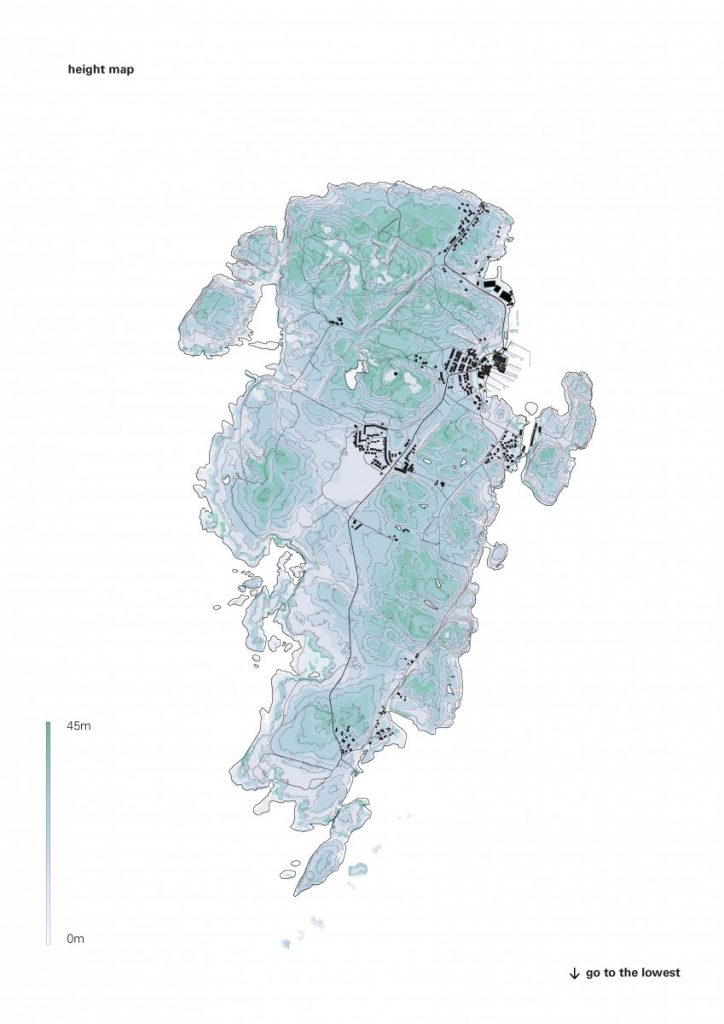
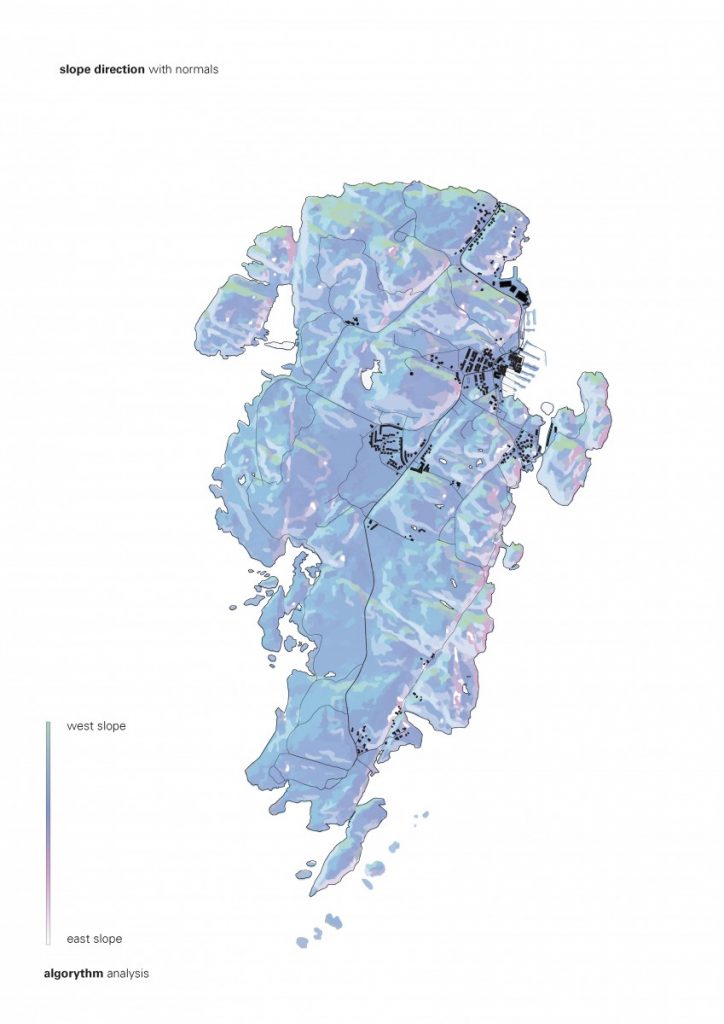
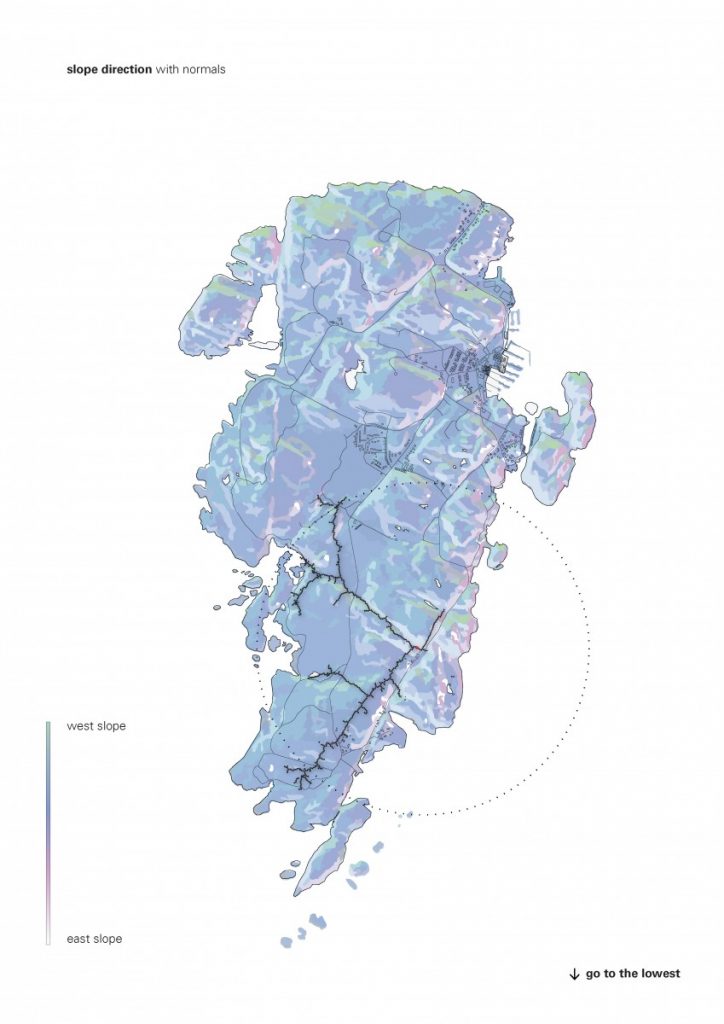
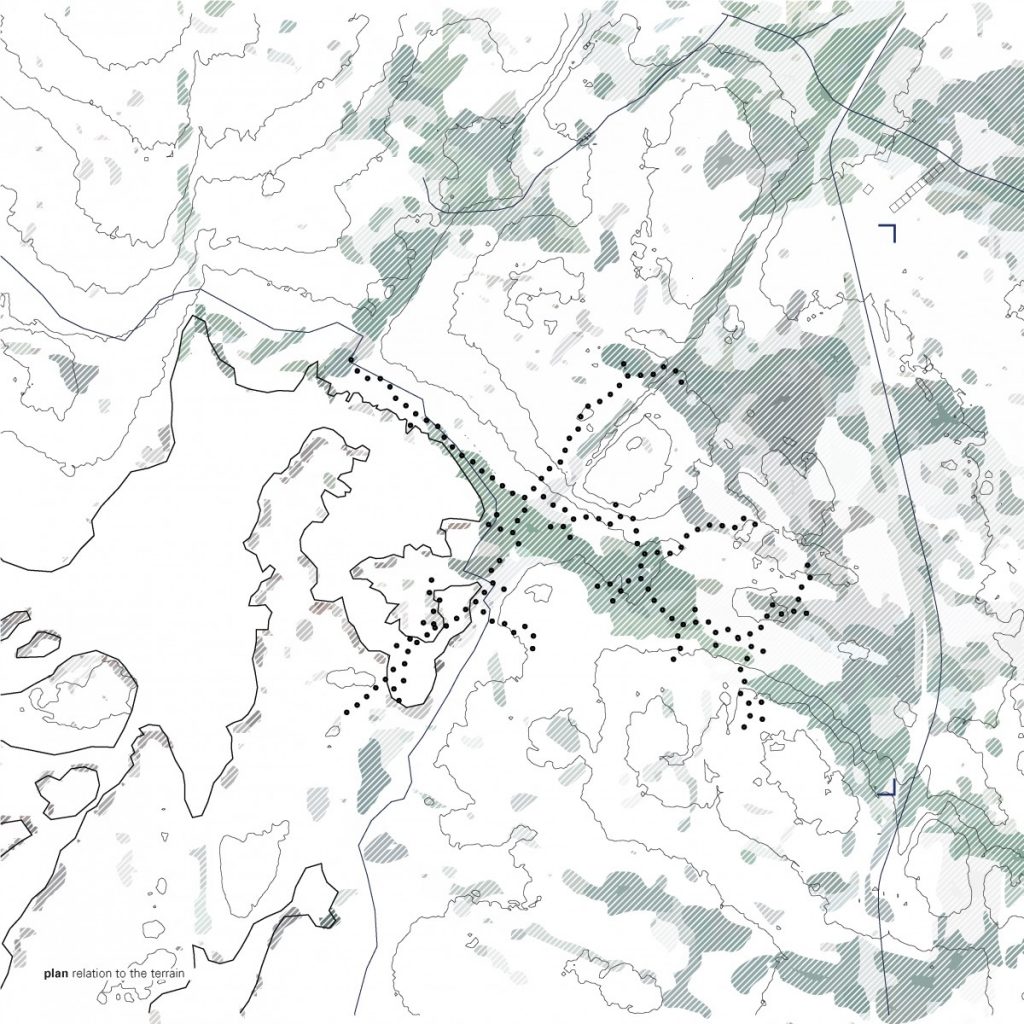
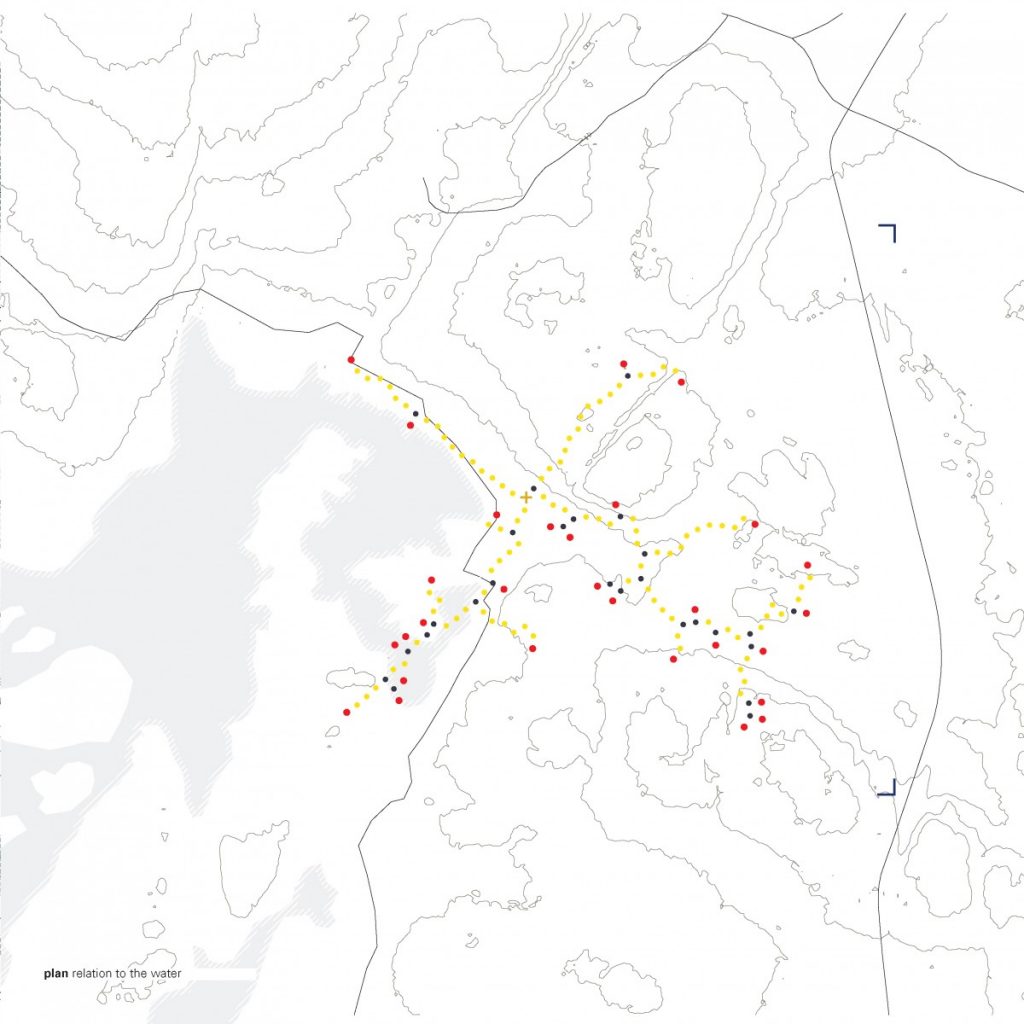
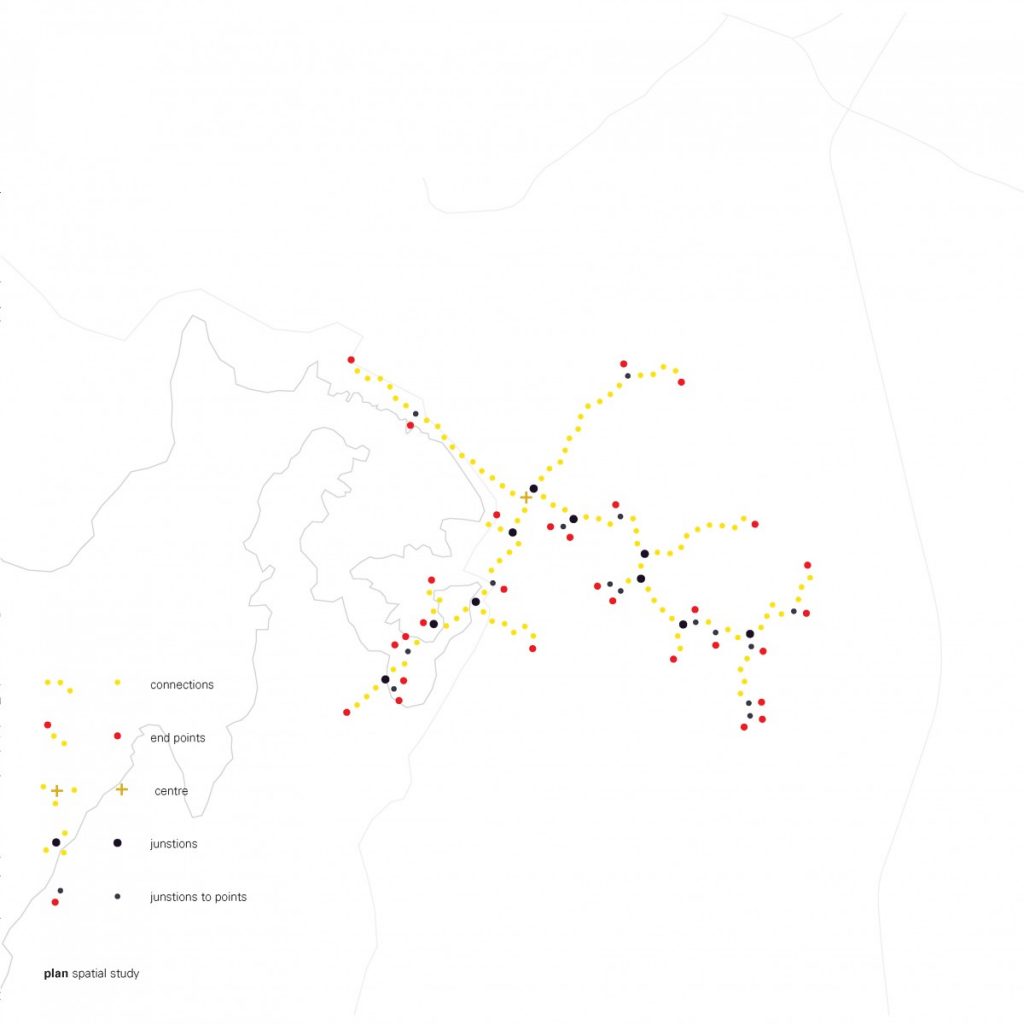
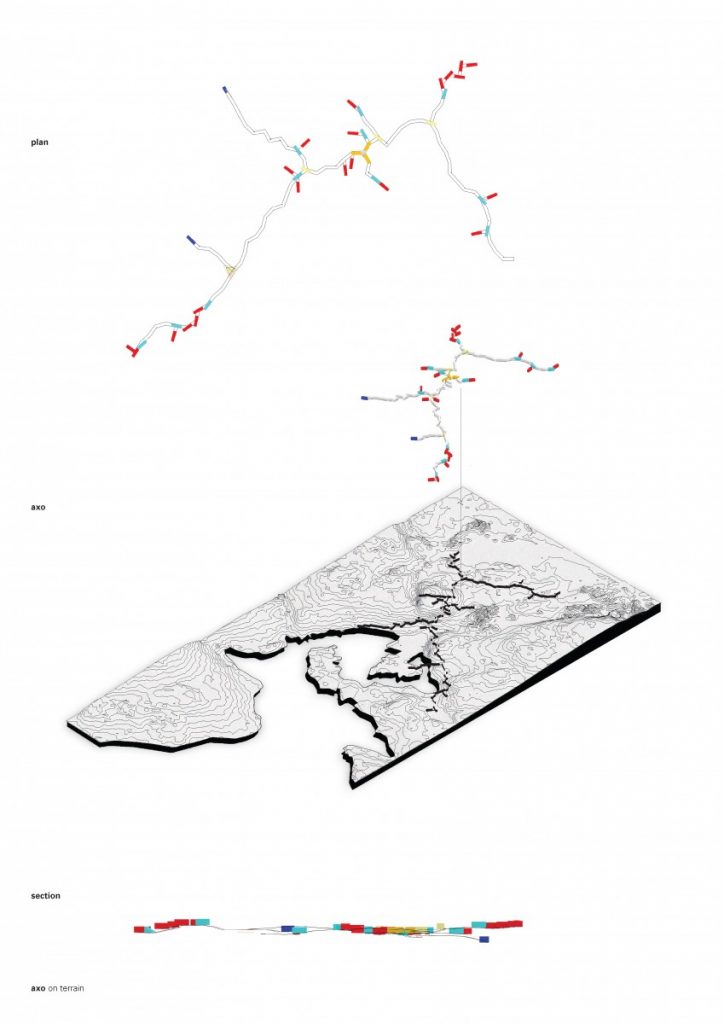
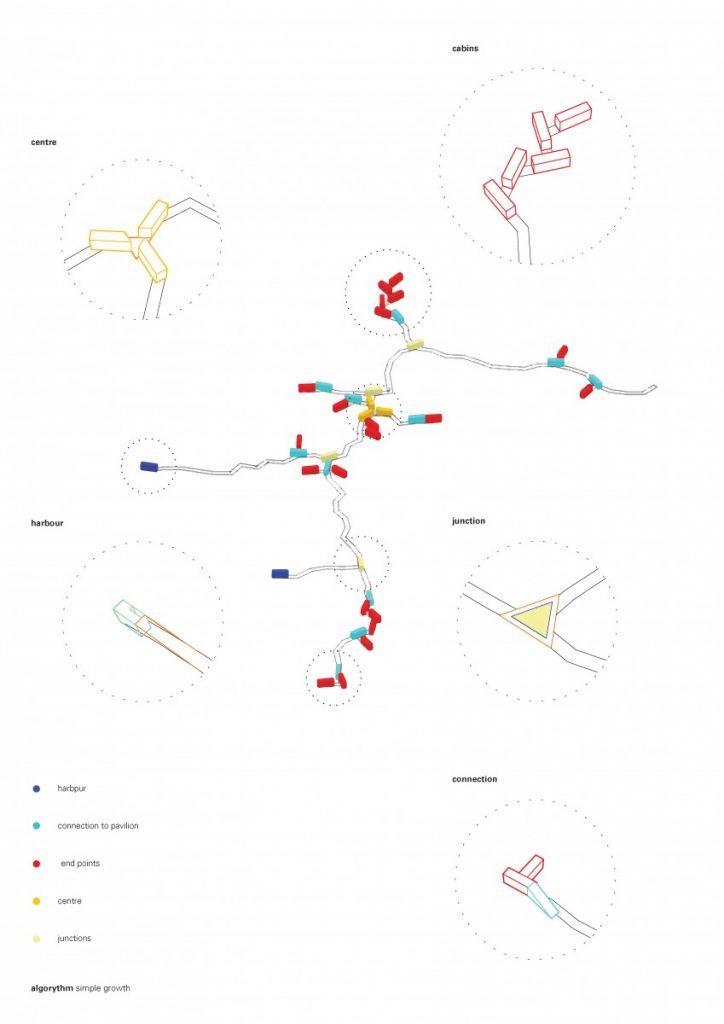
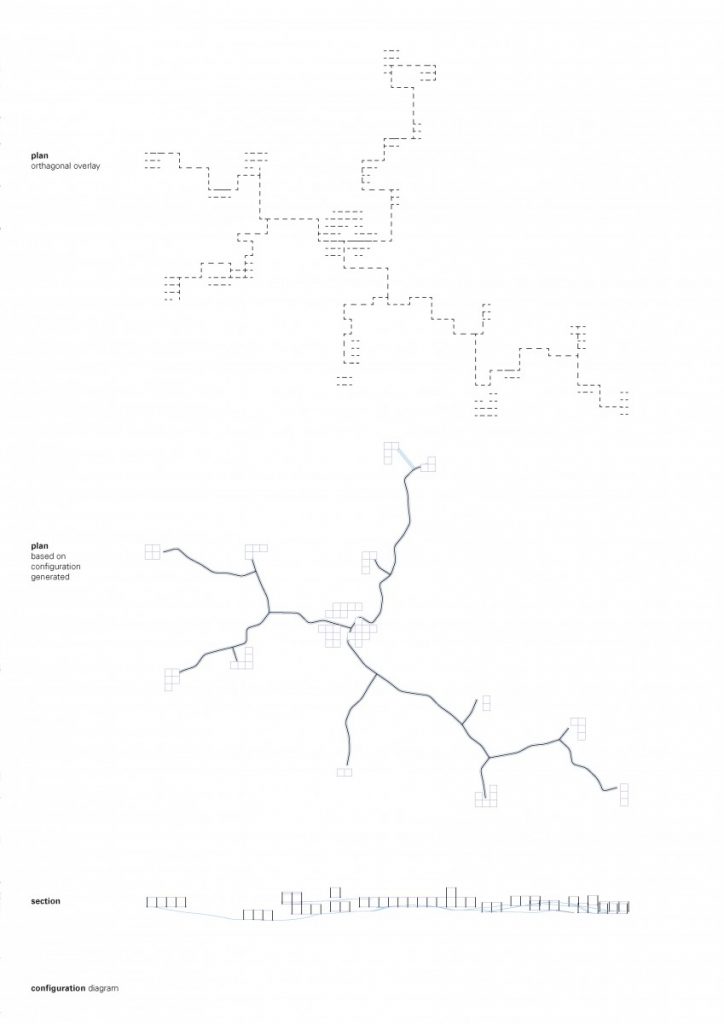
The path that is a spine for the camp is generated from a simple growth algorithm, that reads terrain heights and allows for the growth of points, where the endpoints are always growing towards the lowest parts of the island. This became clouds of squares and I overlaid an orthogonal thread that rambles around the main core, creating the main composition line, to place more modules along the walkway.

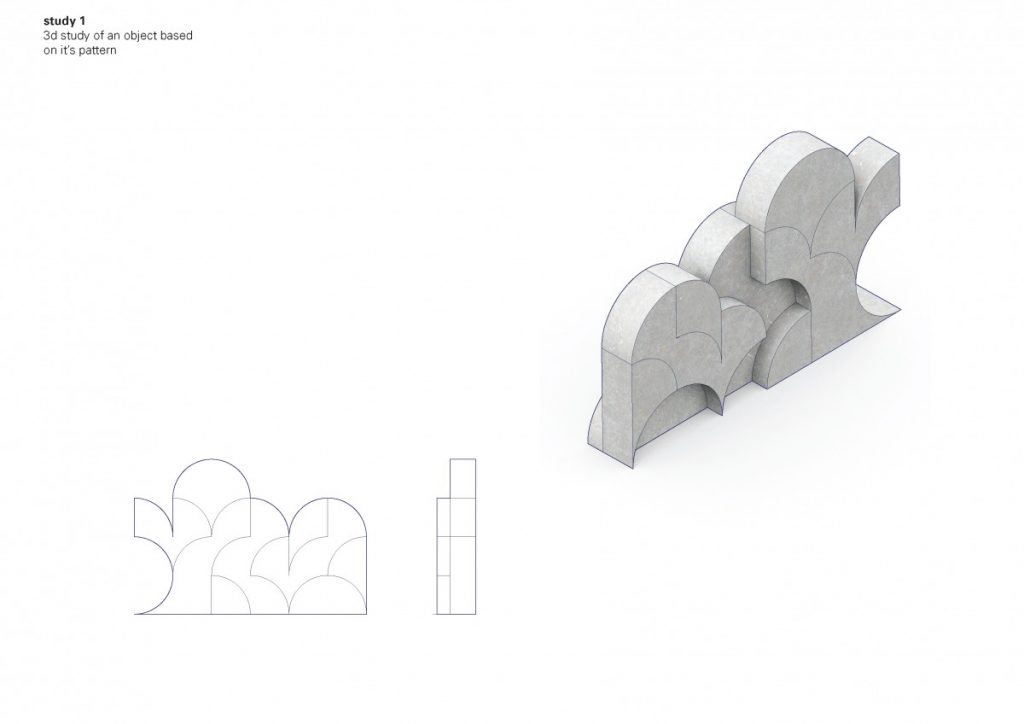
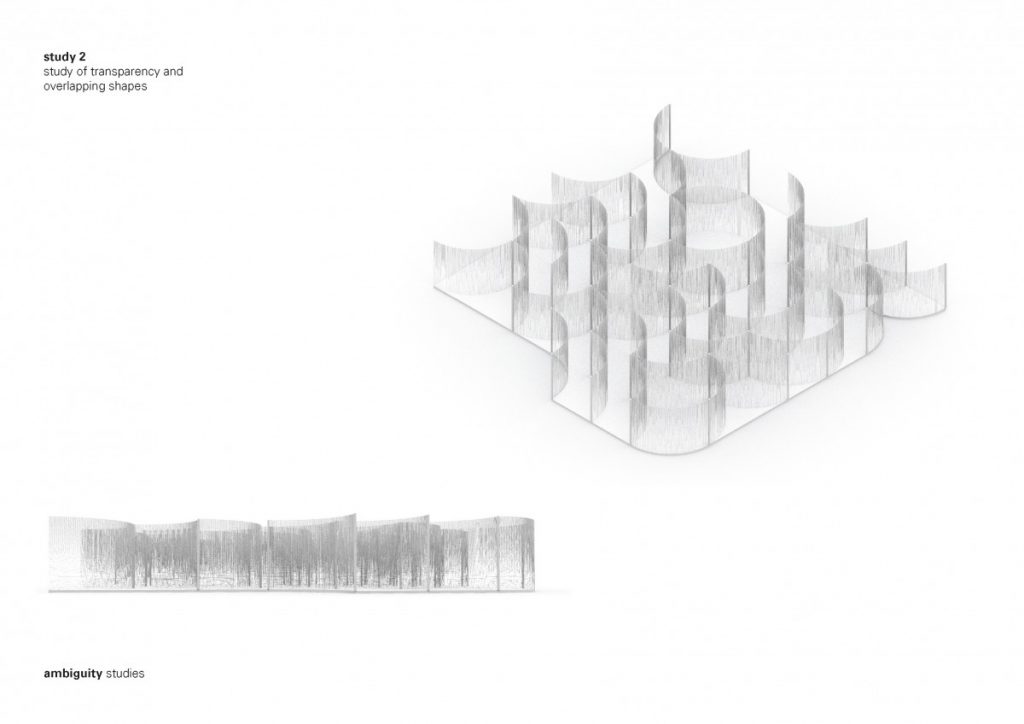
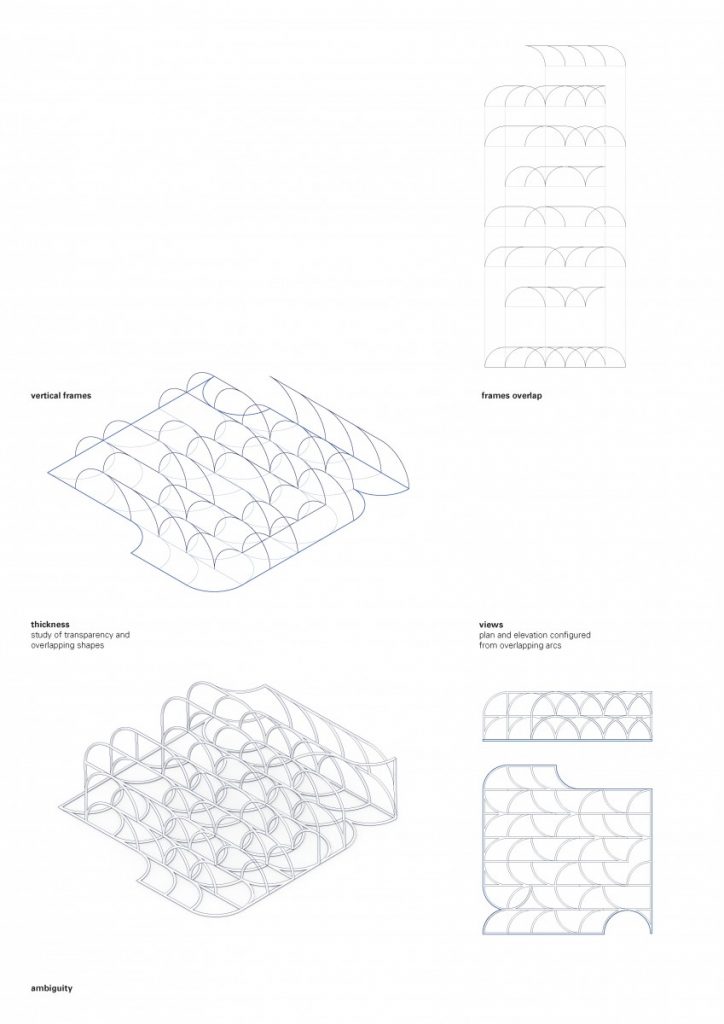
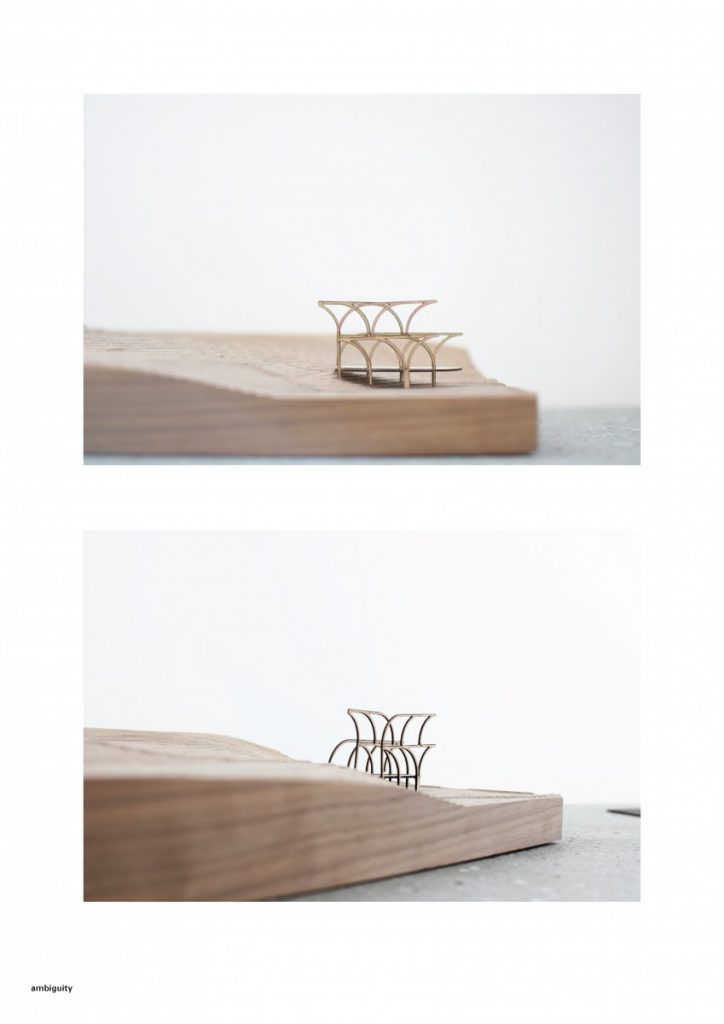
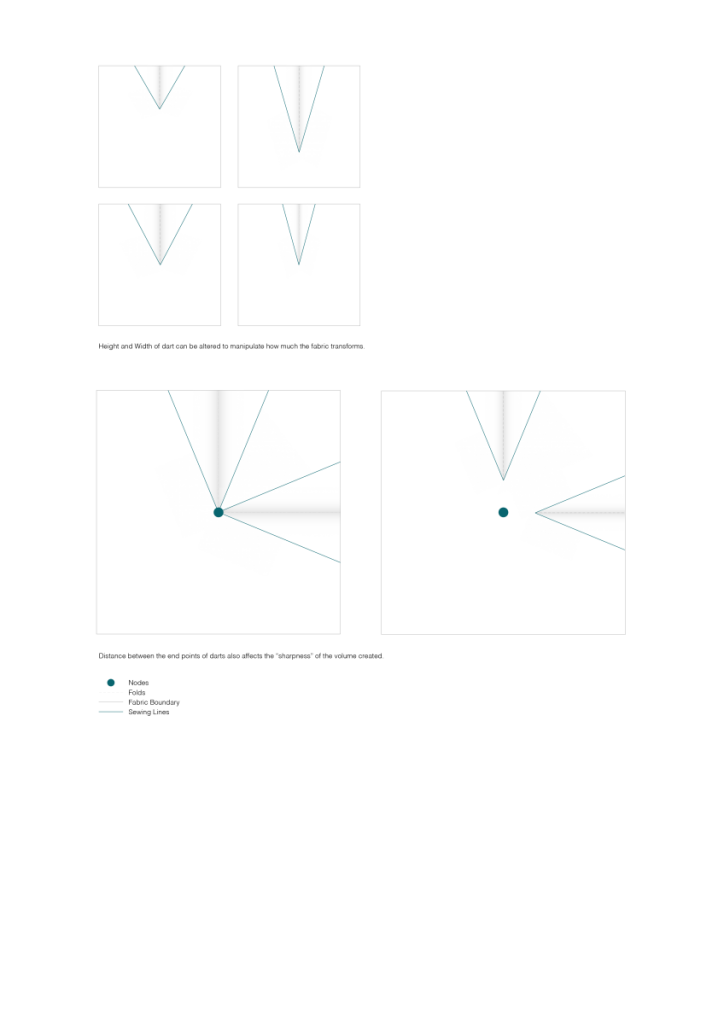
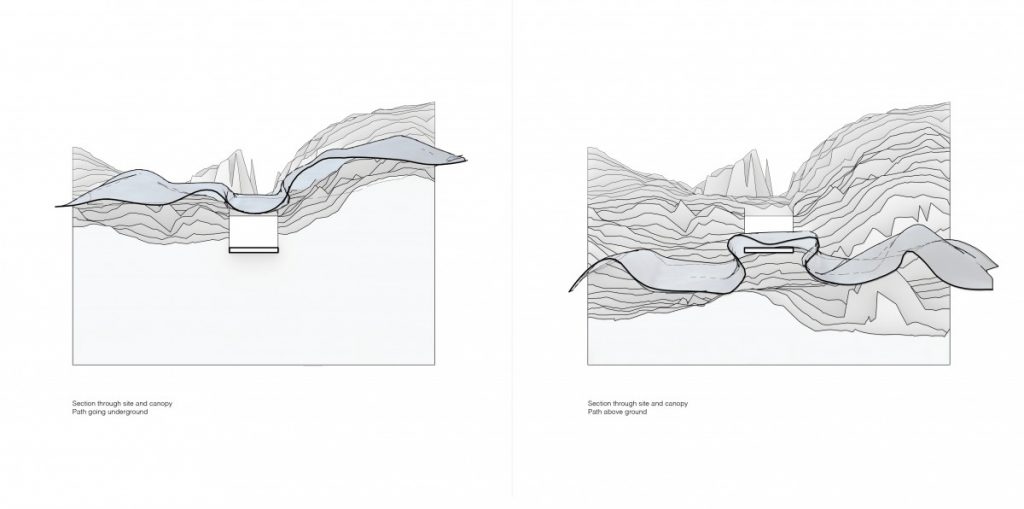
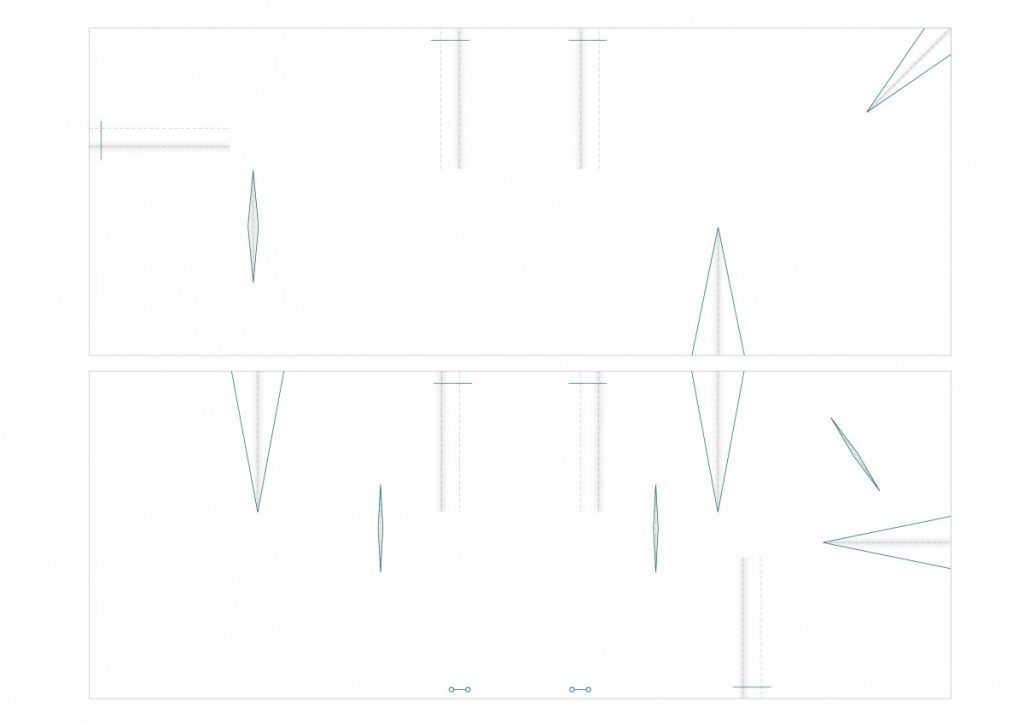
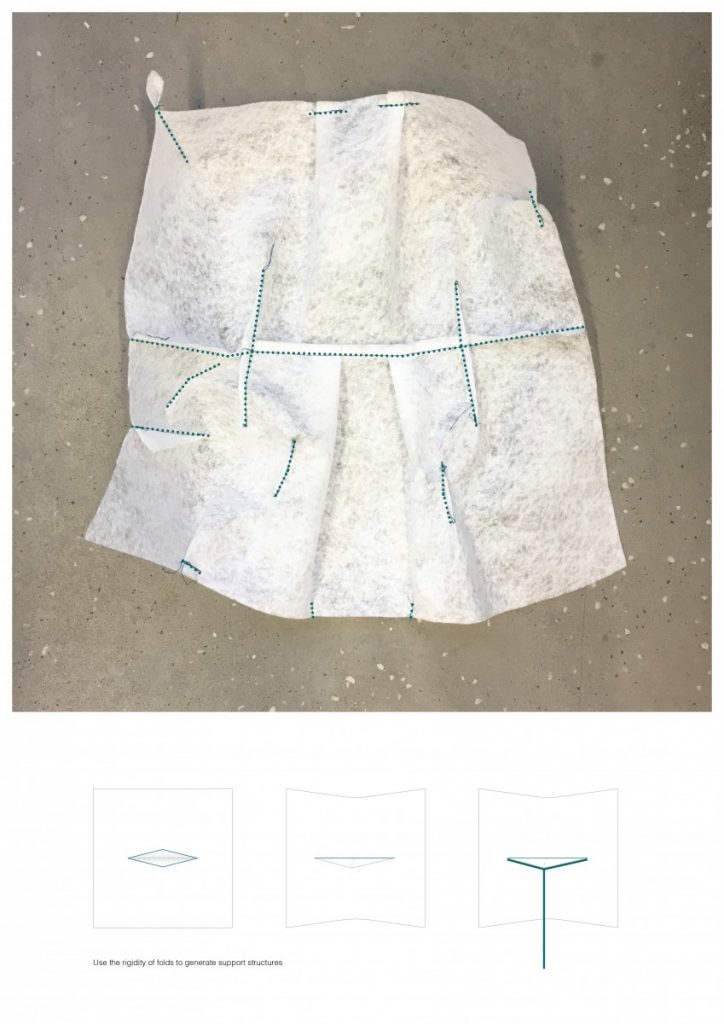
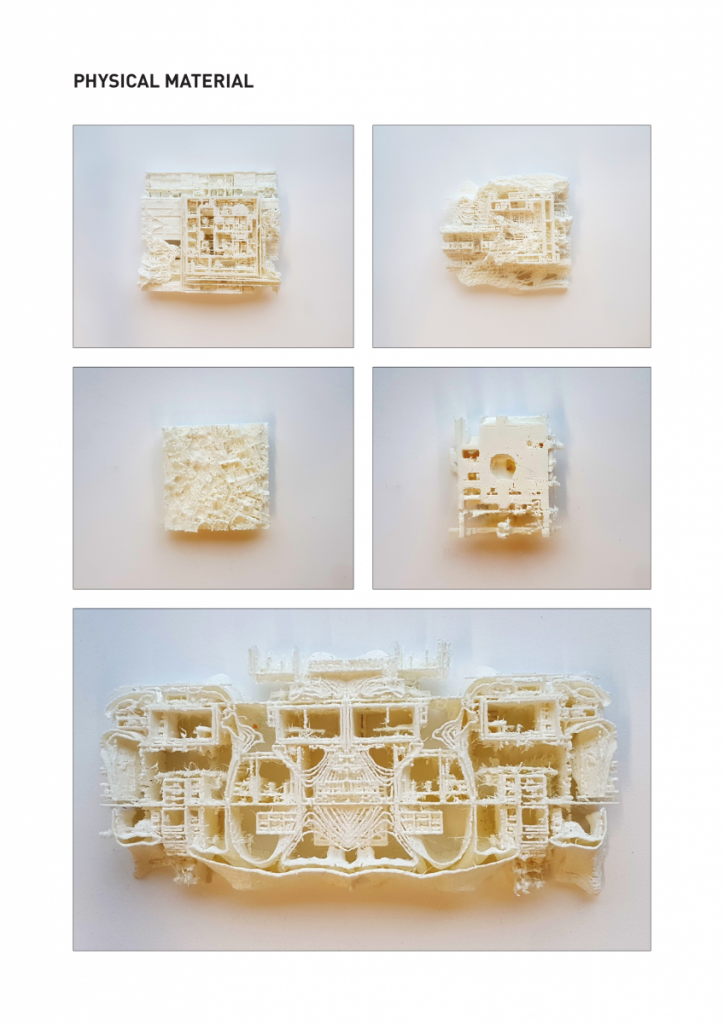
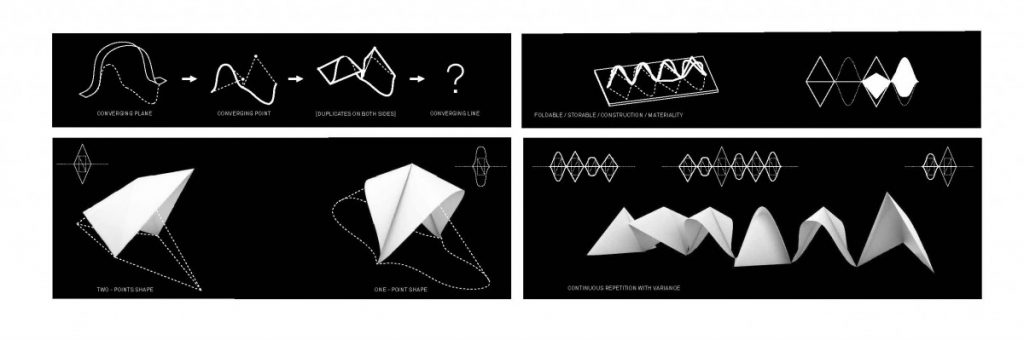
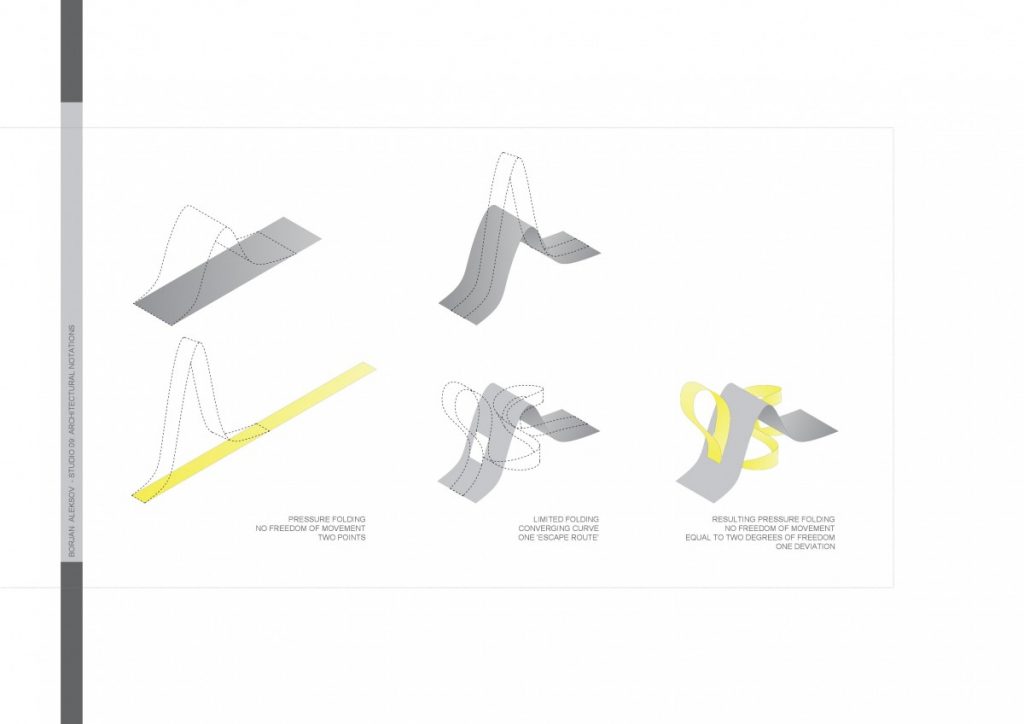
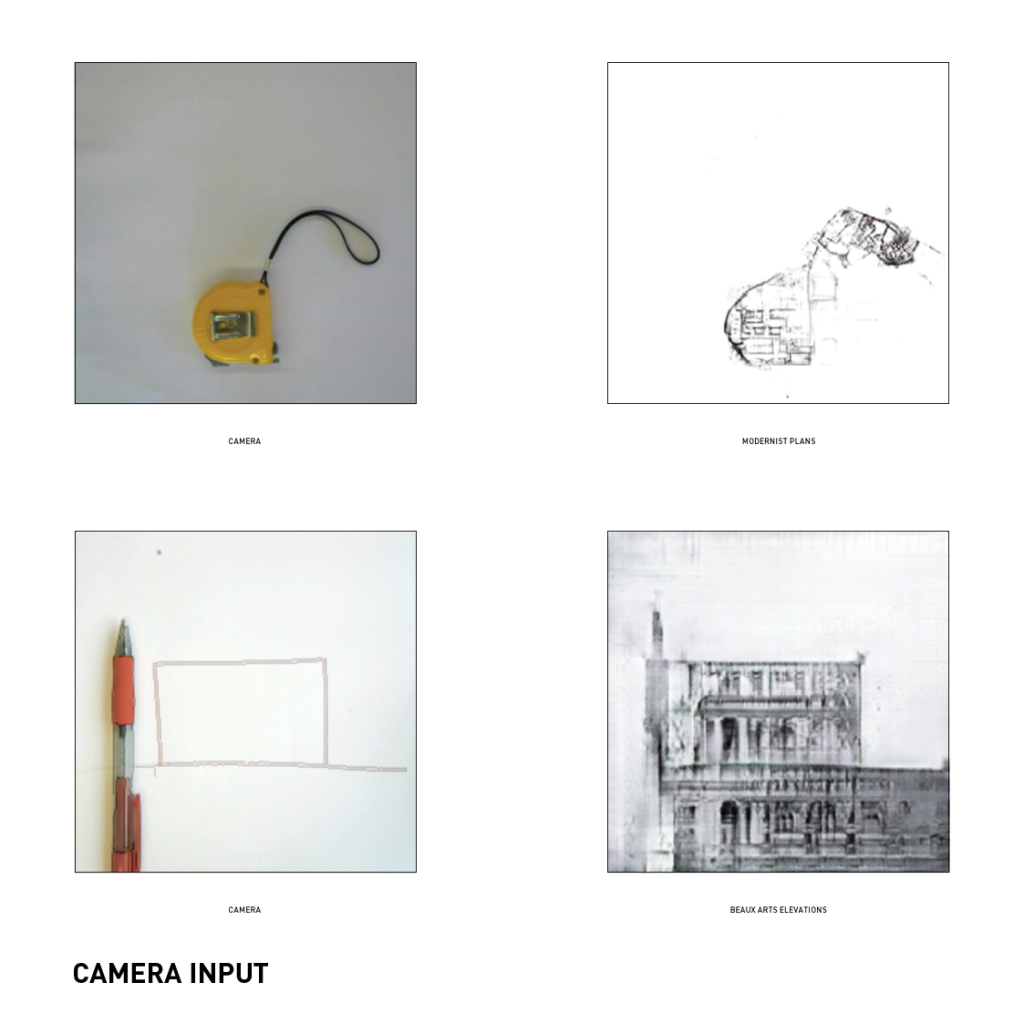
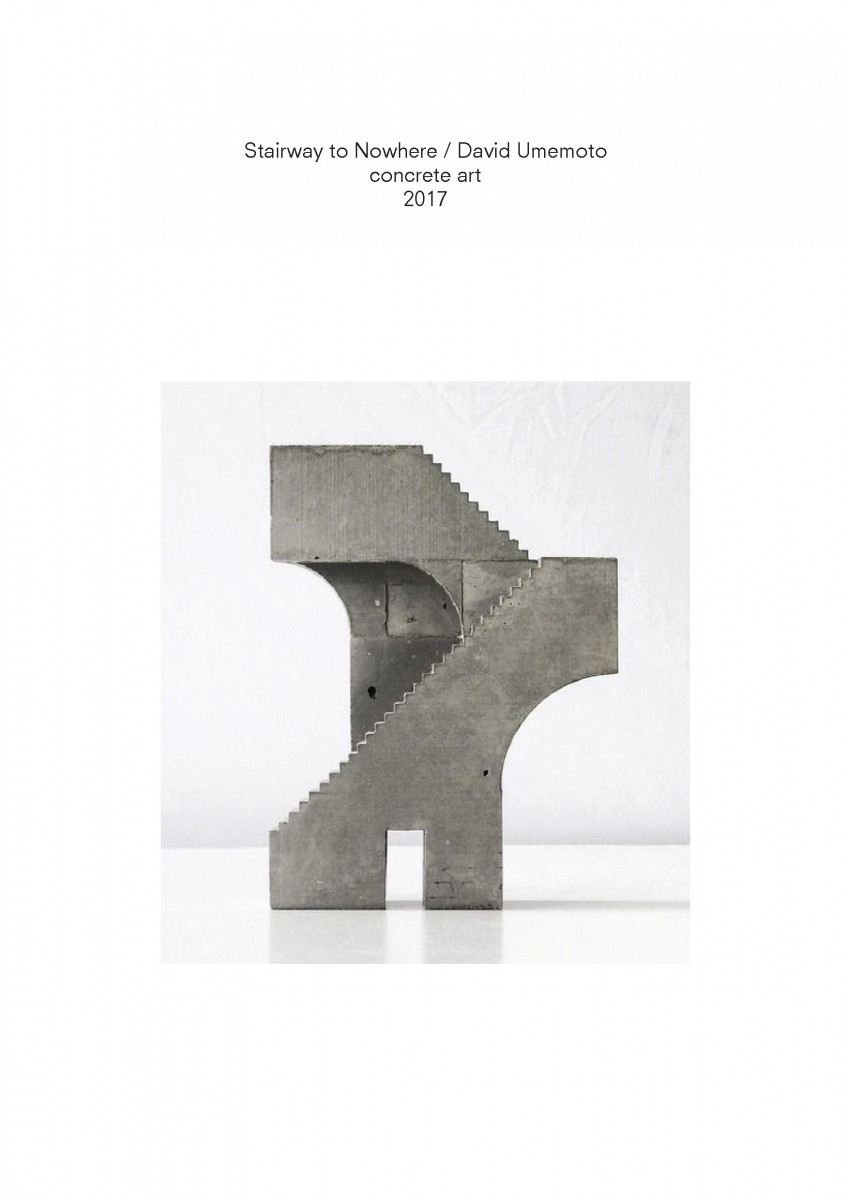
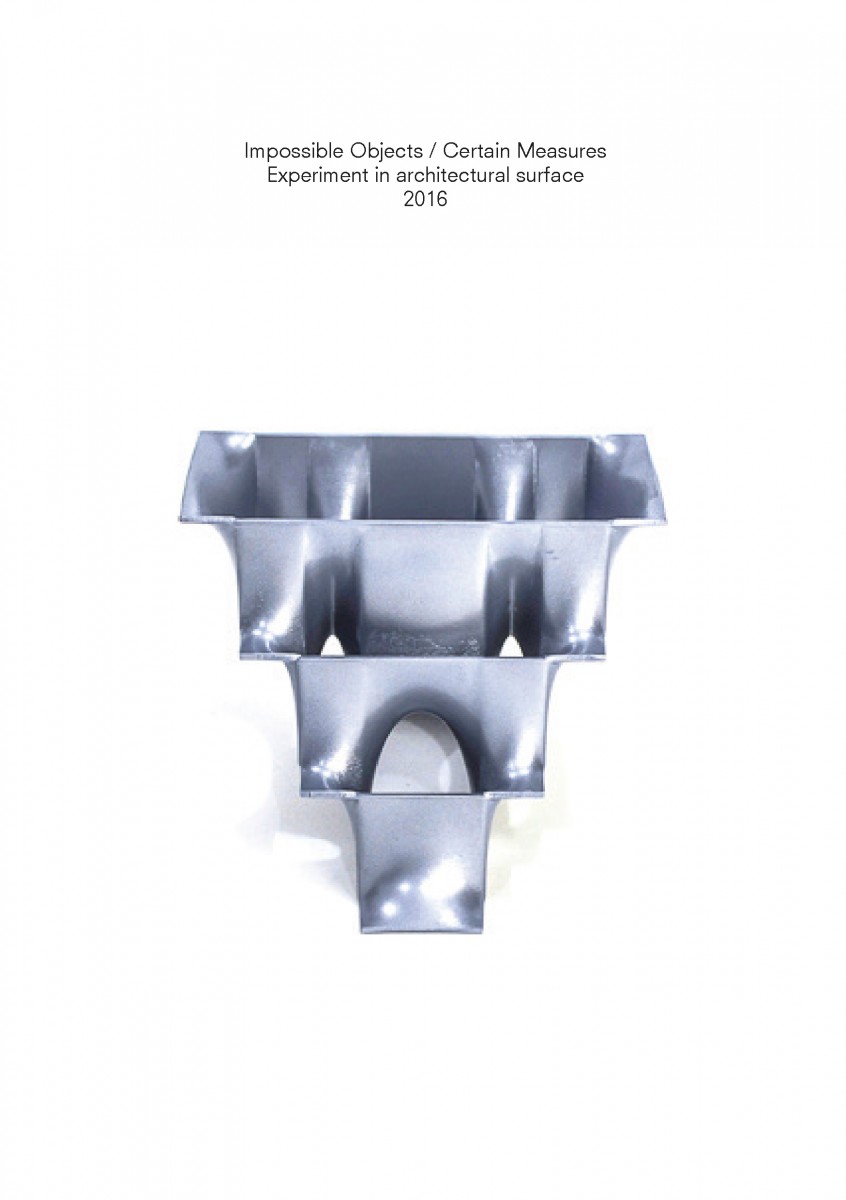
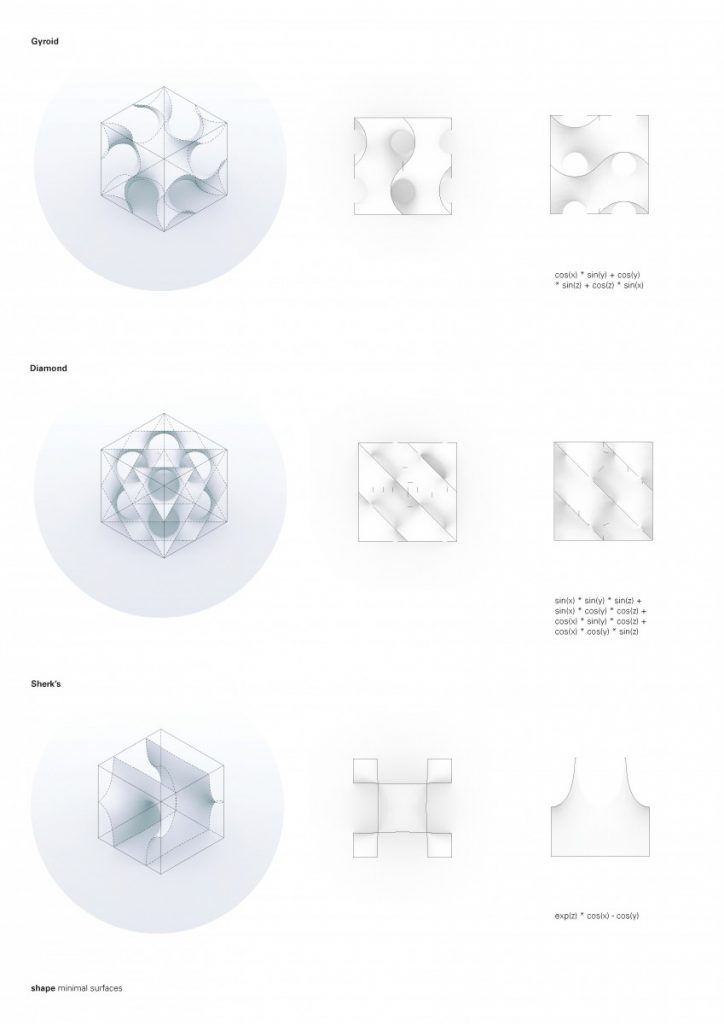
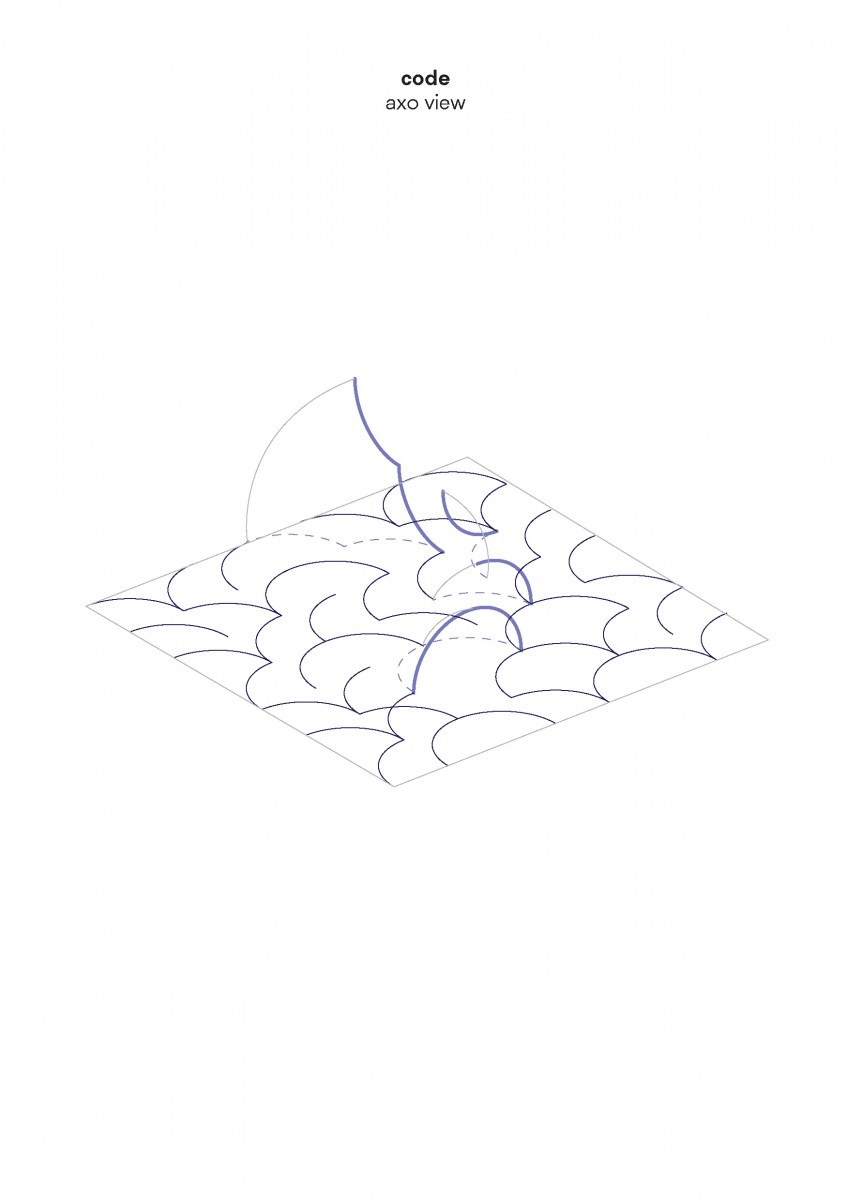
Minimal surfaces One of the qualities that whose figures have that grabbed my attention is the simplicity of the boundary and complexity of the surface that meanders between it. The elevation views are expressed by a simple configuration of one repeated arc. The perceptual ambiguity of overlapping shapes gives depth to the figure.

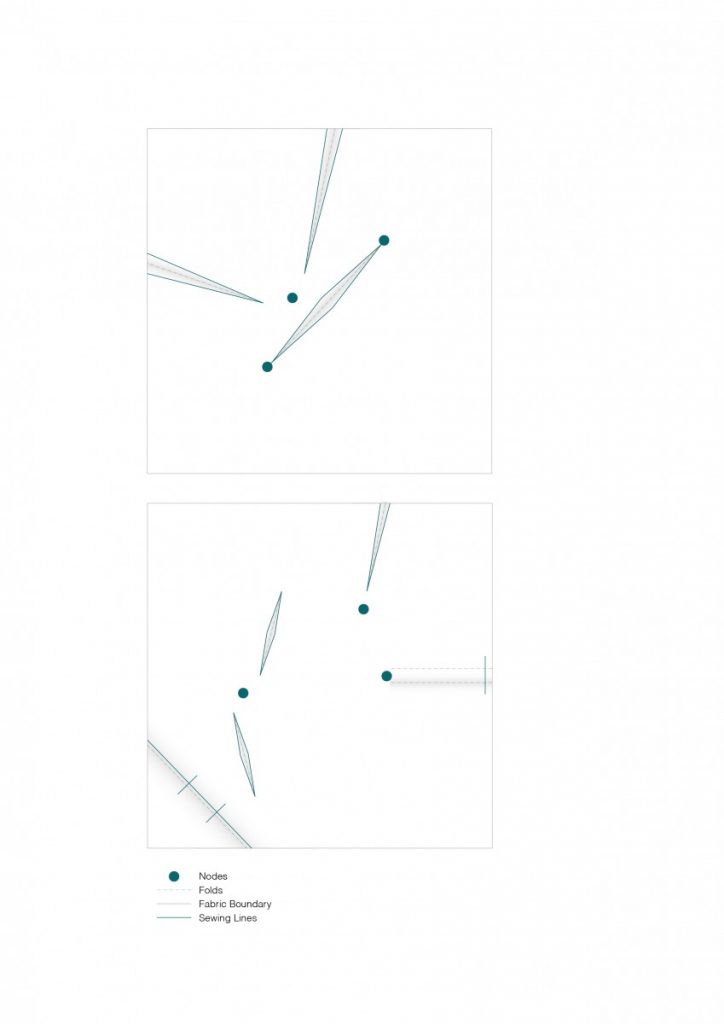
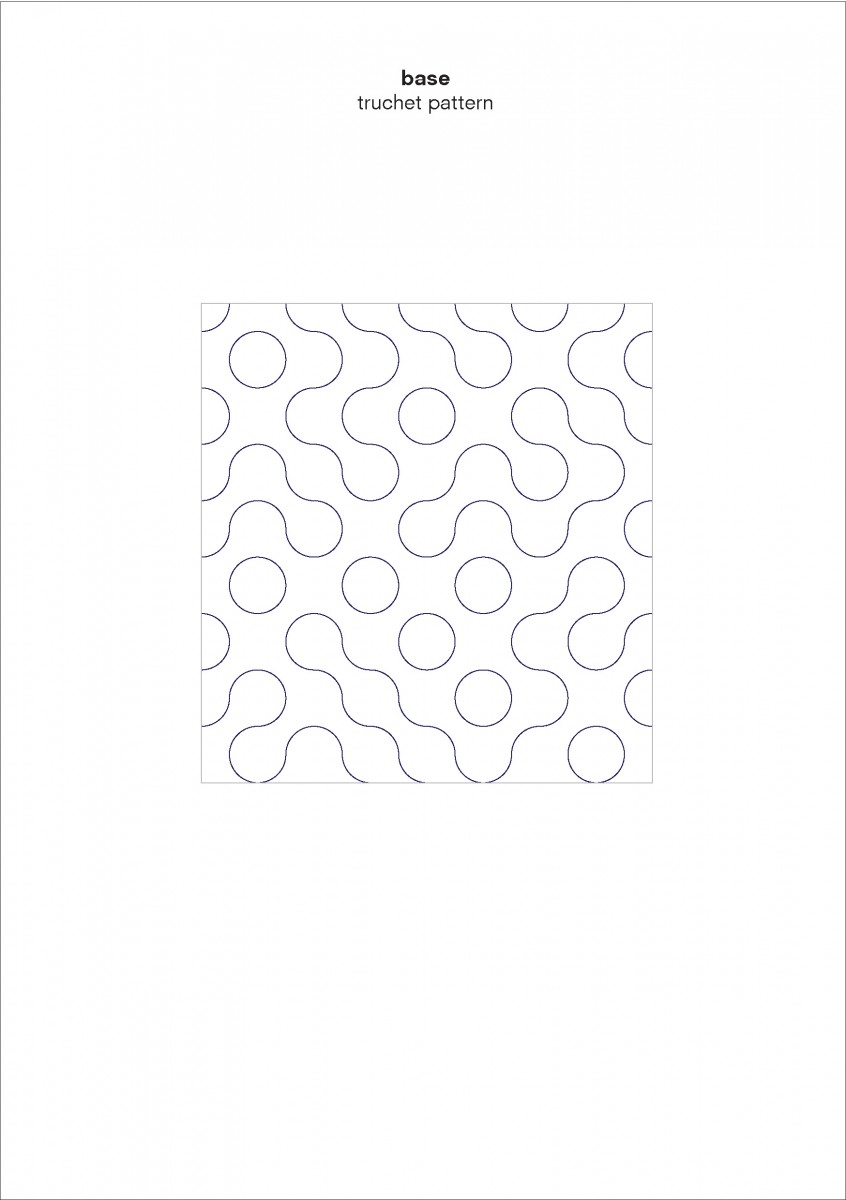
So – How do I create a base for my minimal surface? How do I do it, having a defined and regular shape?

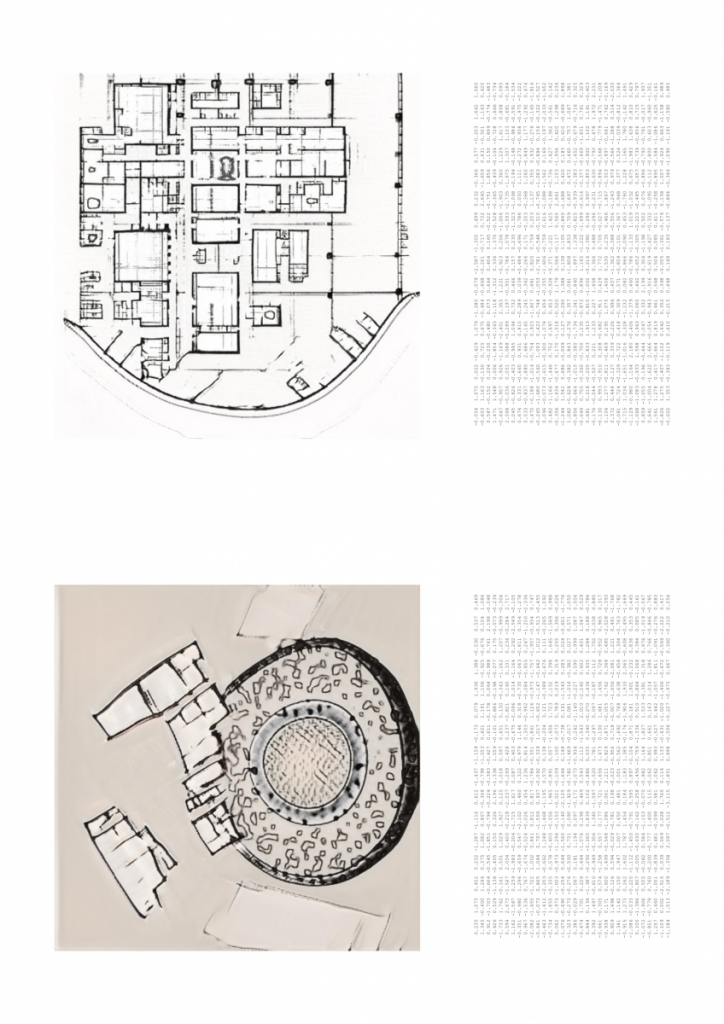
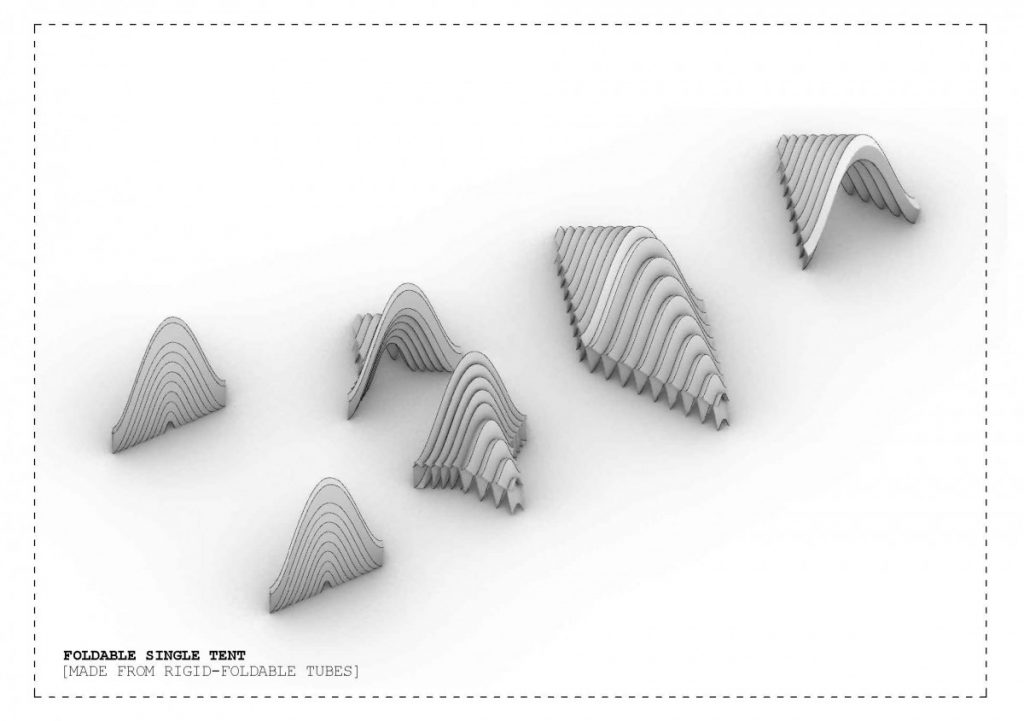
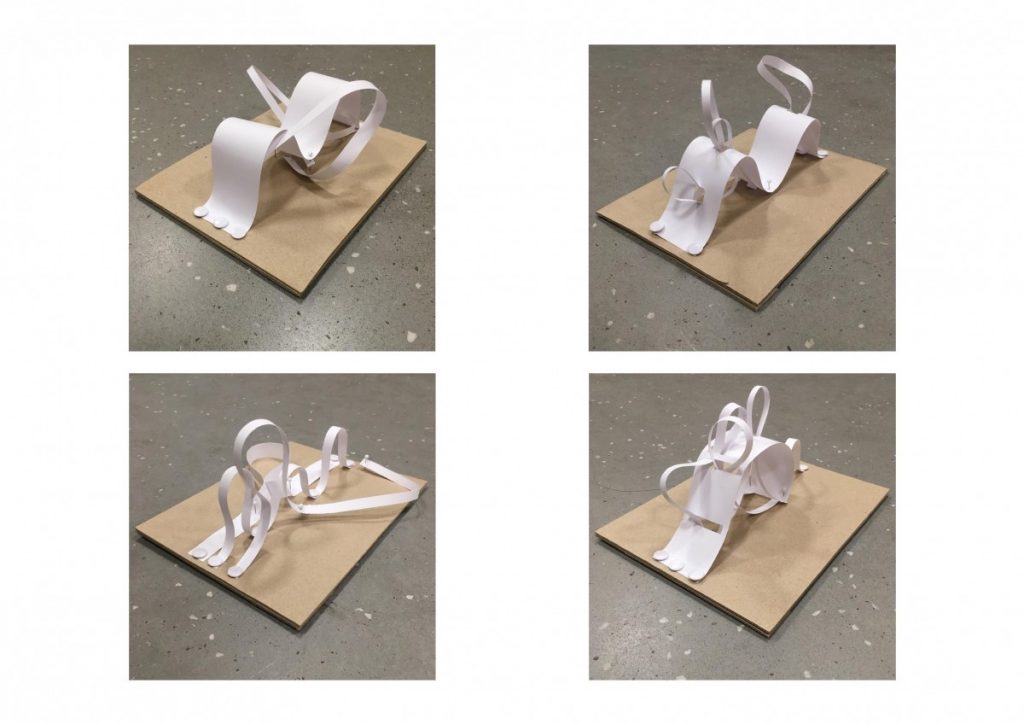
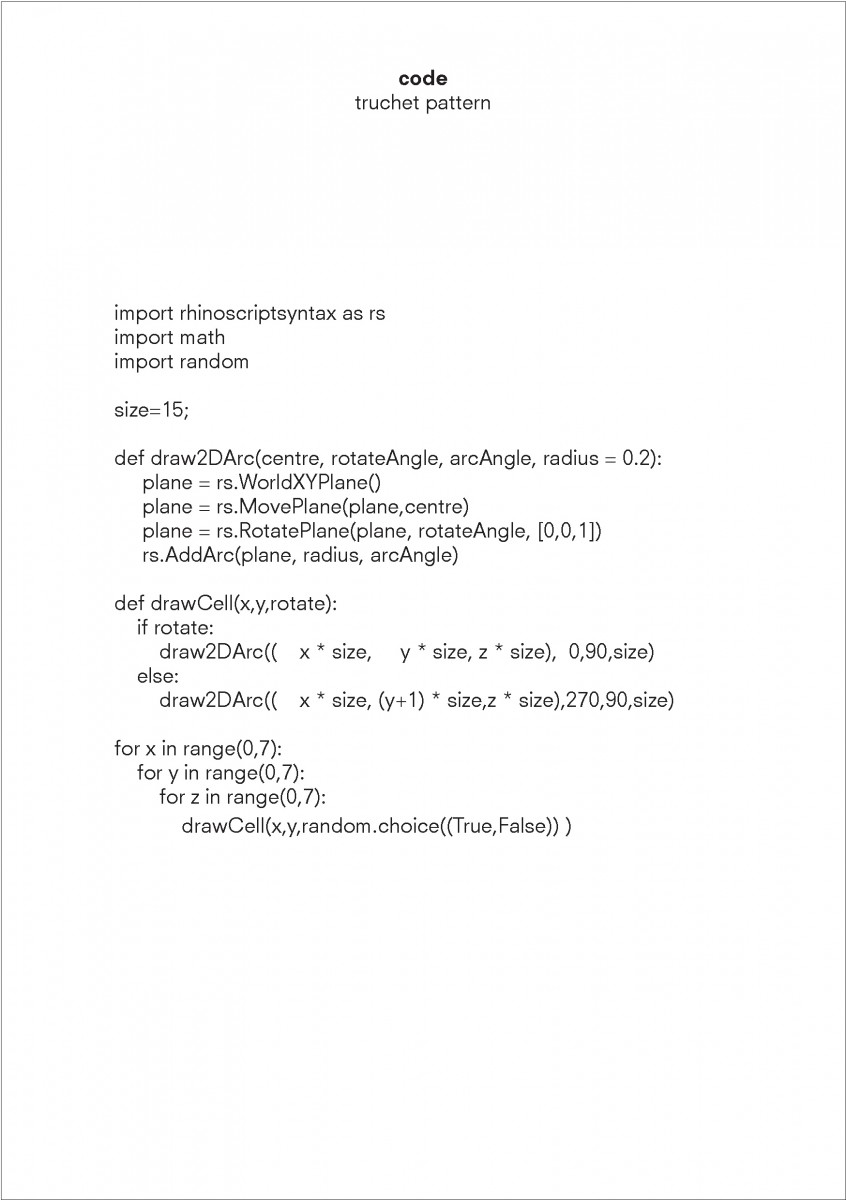
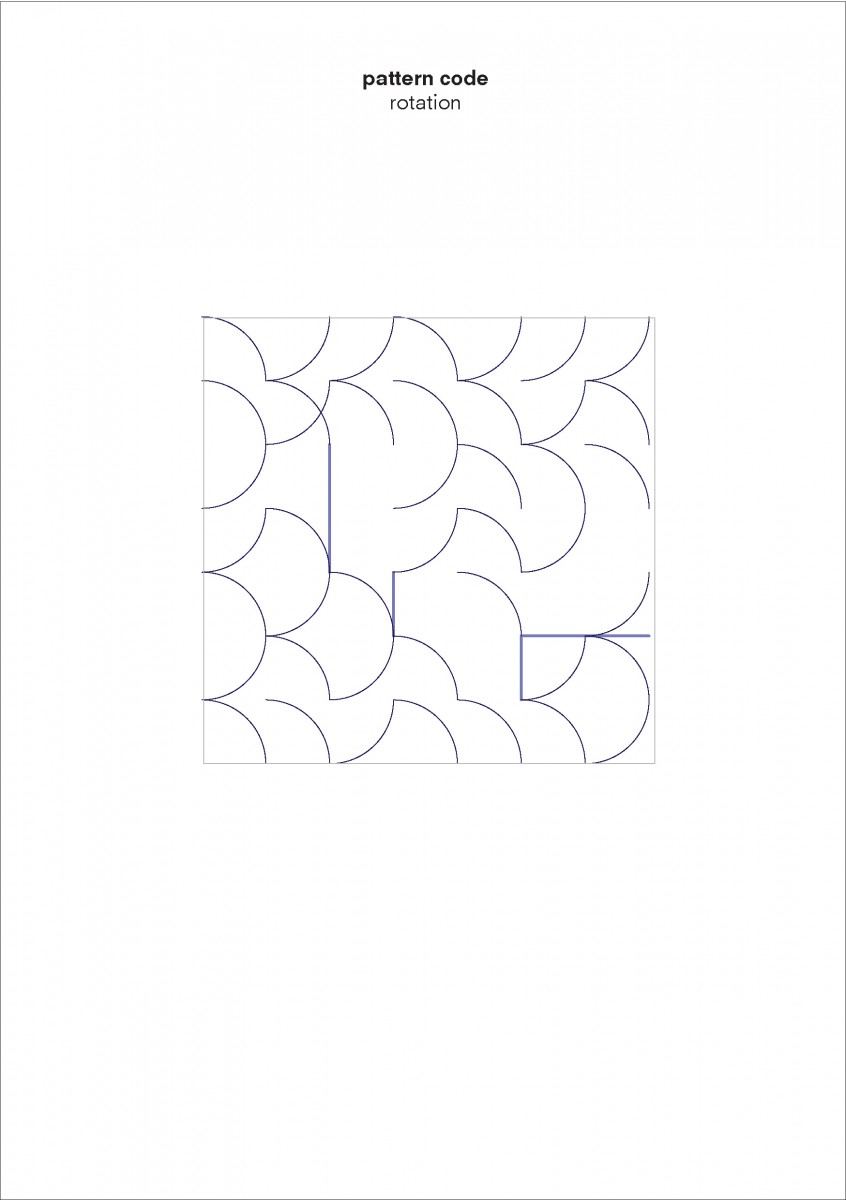
Here came the idea of creating a defined shape from a repetitive pattern of arcs. As a base to generate the configuration I used Truchet code.

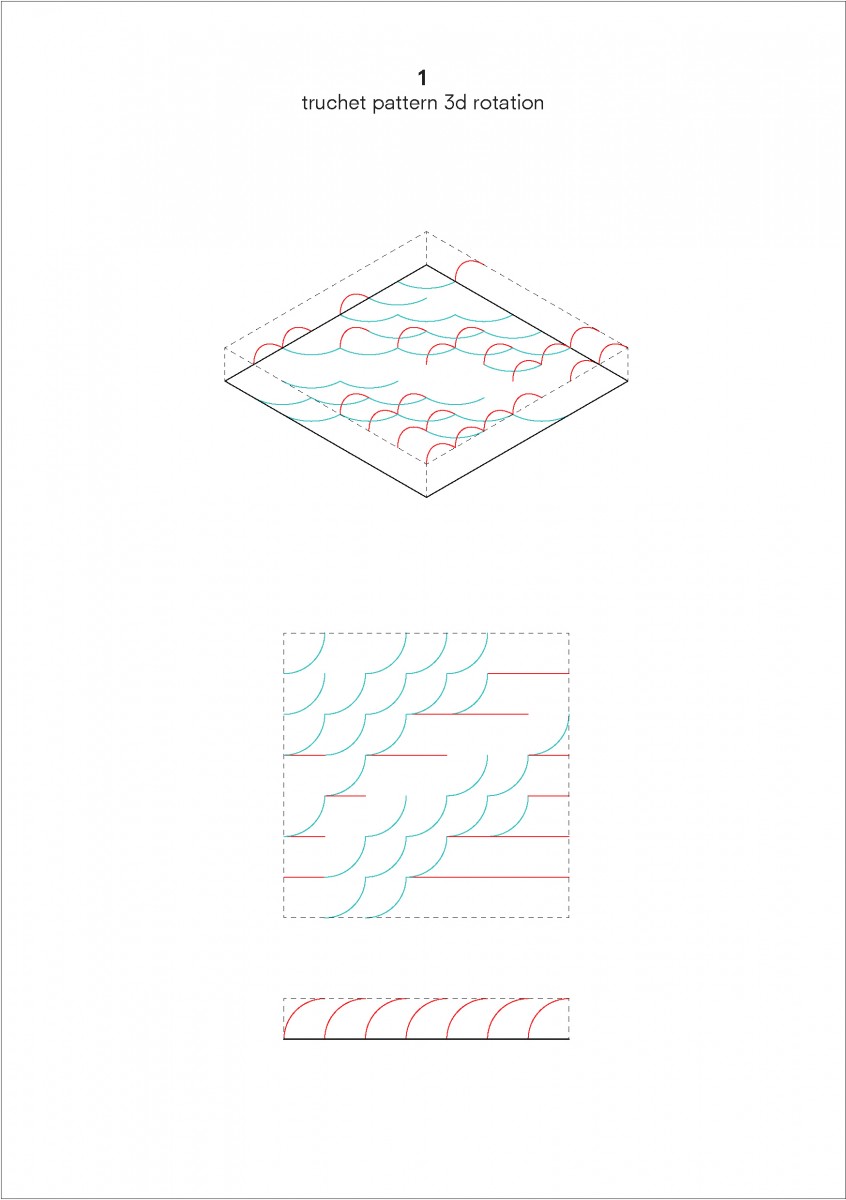
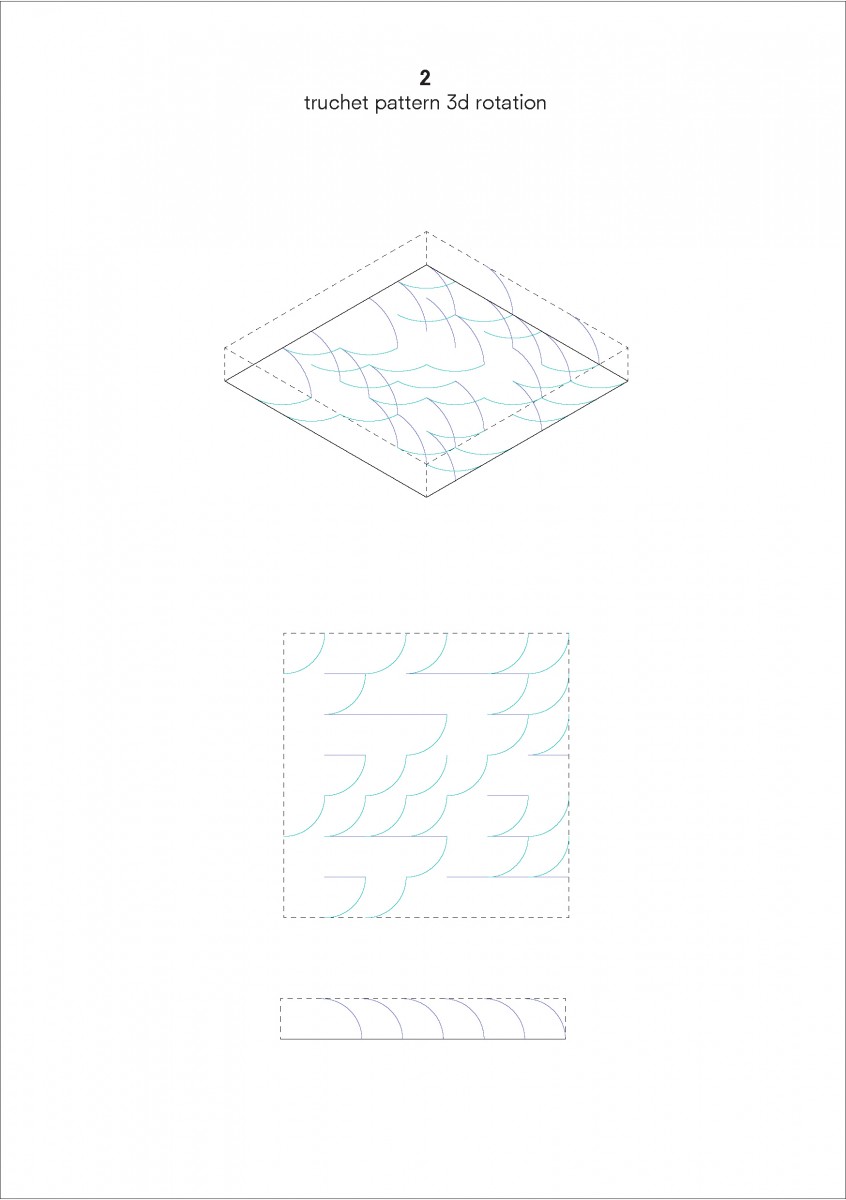
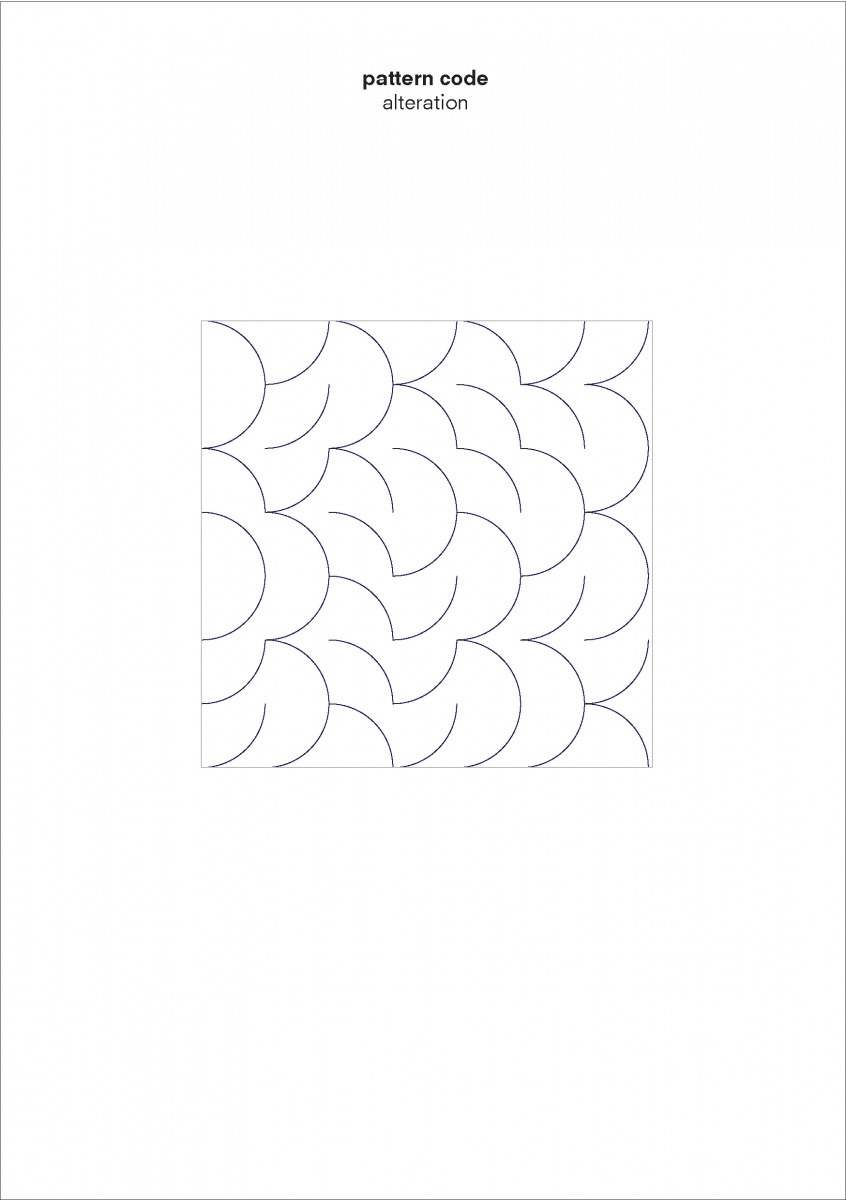
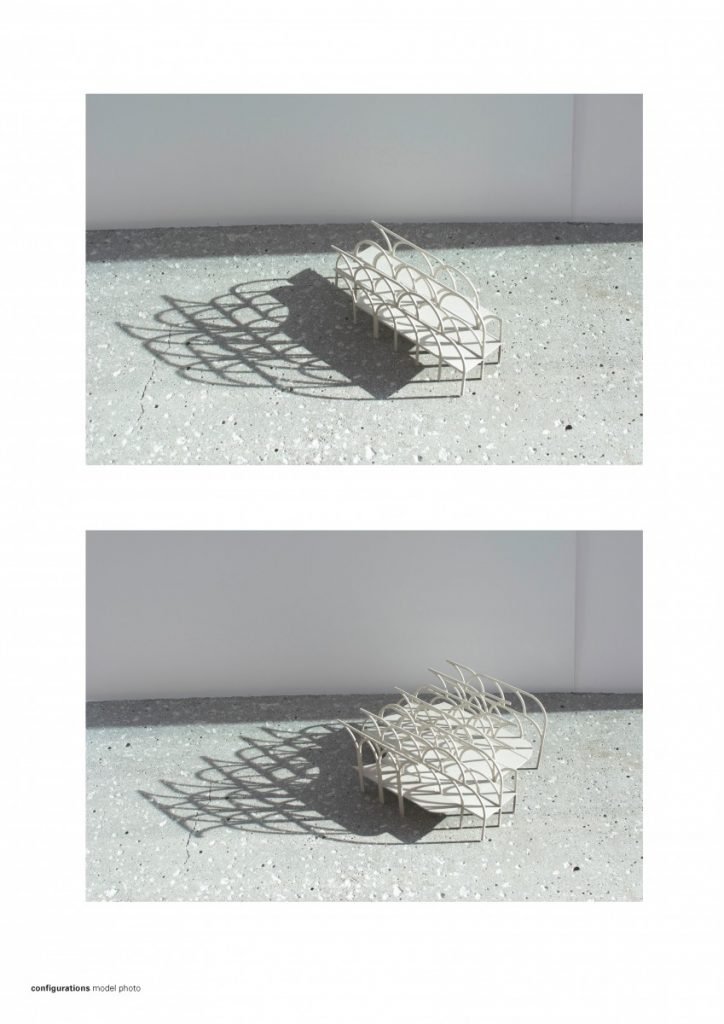
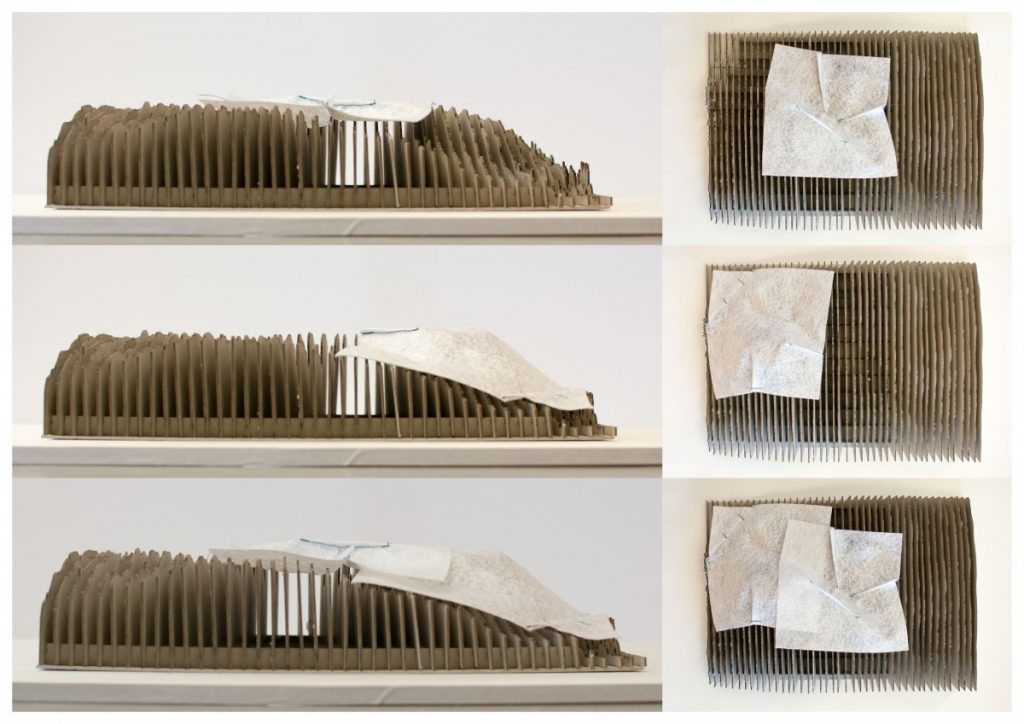
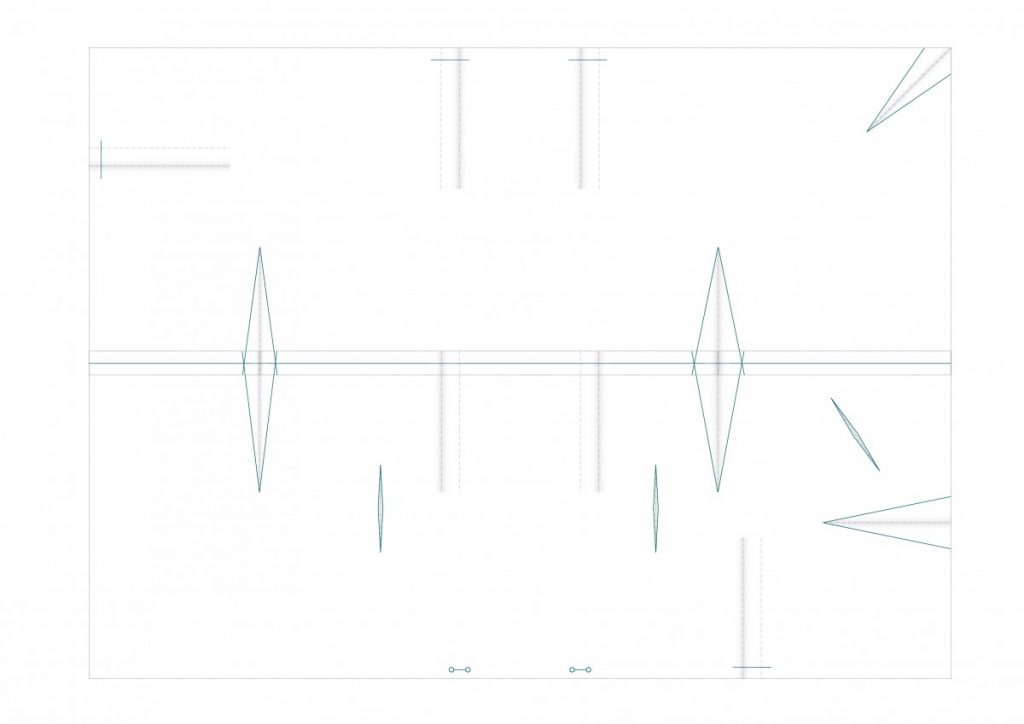
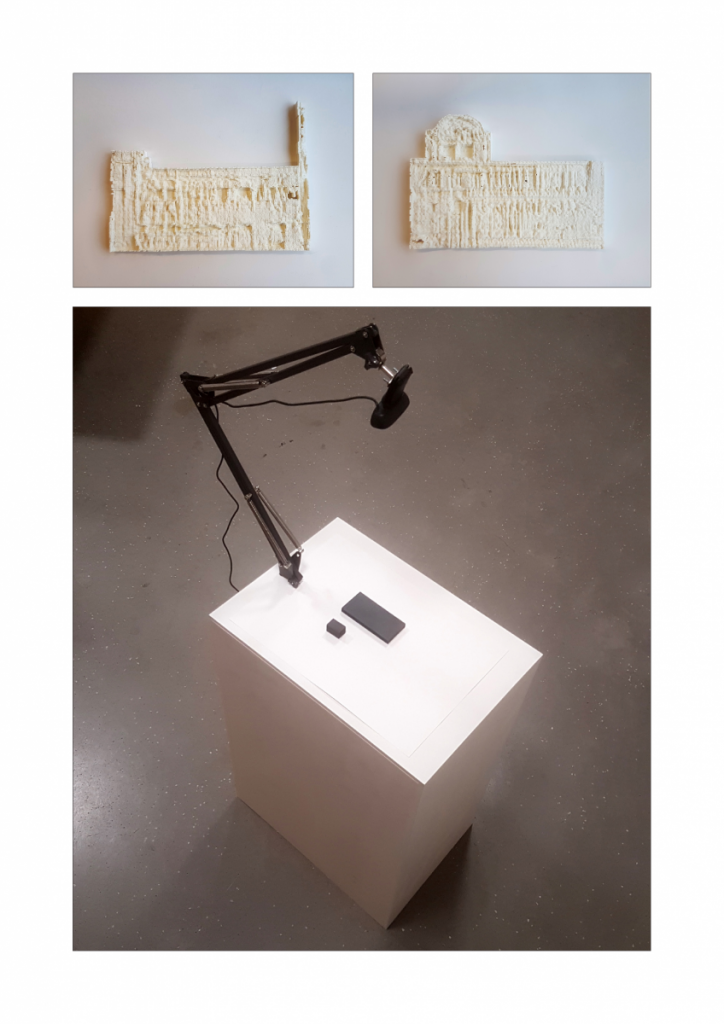
Studies above are showing, where from the pattern I extracted shape and gave it some depth by moving some modules horizontally, but the pattern is still readable from the front view and is still very simple on the side.

I was playing with the same configuration in different planes. Here I created a defined shape based on the generated pattern, by getting rid of some arcs and adding some orthogonal lines.

Project 4: Material Transactions

Architecture is how the person places herself in a space. 
Fashion is about how you place the object on the body.

Zaha Hadid

Many references are available for fashion that is inspired by the forms and techniques of architecture. 

This project is an exploration of the reverse- architecture that is inspired by the forms and techniques of fashion. 

Pattern drafting on a mannequin

Traditional pattern drafting techniques involve finding ‘nodes’ along a figure that have the maximum amount of curvature. Fabric is then draped starting at these nodes, and adding shaping techniques to fit the fabric to the form.

Pattern drafting methods
Fabric shaping techniques
Test models of sewing techniques to observe geometry
Darts in more detail

My next step is to apply this process to the site topography. The area I have chosen to work with is where the children’s sleeping quarters are, as it has a variety of scenarios related to the position of the path in the landscape.

Site plan

To do this, I have made a site model which I use as a sort of mannequin. The process involves laying fabric over the model, pushing it into the nodes and pinching darts and pleats into it to mould it to the site.

These fabric models can be unfolded into patterns, that can be repeated to create the same complex forms.

After these tests, I have re-introduced the path from project 3, and moved up to working at a larger scale.

Process

The two scenarios create different spaces, and their ‘patterns’ can be aligned and joined to create an interesting transition.

Pattern pieces separated
Pattern pieces joined
Generating support structures from folds

Stage one of the project resulted in a simple yet bold infrastructural loop connecting various elements of the campsite. Stage two created spaces by moulding and fitting a canopy to the site.

The shelters (final)

I have continued on exploring the limitations and restrictions of the rigid-foldable tubes. The constructed prototype models showed that the sine curve would induce movement in two directions during contraction. In order to solve the problem within the limits of rationality, a decision was made to simplify into a curve, which implies movement in one direction. Additionally, I explored the positioning of the tubes and concluded that it is better to substitute the continuous repetition with dynamic shape-changing tubes as the slope descends. This gives a steeper curve that is smooth on the inside with increased structural integrity.

The units are positioned in a continuous chain around the defined areas, within limiting boundaries defined by the insolation conditions. The proposal demonstrates the foldability (contraction) of the shelters and their potential dismantling during winter.

During the final presentation, an observation was made that the shelters could remain attached during winter. Their structure would allow snow to fill the gaps (thermal bridges) and provide isolated volumes, which is favorable for winter conditions.

Contracting rigid-foldable tubes

After the introduction of converging planes, I extracted one of the resulting curves and reintroduced convergence, but this time the limiting element was a point. A few tests and adjustments resulted in selection of two ‘visually optimal’ shapes. Thinking of small-scale structures I envisioned them as tents for one person. The next step was to explore different approaches for inside-outside movement with a system of foldable elements that allow opening/closing.

The first proposal is based on the idea of curved rigid-foldable tubes. Their structure would allow movement along tracks (rails) as they contract/expand to open/close. At this point, they can be observed as cells that group to form a small organism – camp on the island.

Trying to connect the proposed structures with the context, I reflected on the site-selection task. I concluded that the identified pixels with irradiation above a threshold value are to be used as important factor for arranging the elements. Thinking of the approaches for correlating them, I lost track of the true meaning of these pixels and took a ‘wrong direction’ in the process.

The proposal included two ways of manipulating the pixels into shapes with MATLAB and Rhino. First is the Point Spread Function (PSF), which generates Gaussian distribution of the pixels in a selected region (see graphs that visualize the algorithm). This gives a certain degree of blurring which is determined by the x- and y-axes and an intensity factor. The second proposal uses a Motion Function (MF) that is adjusted for different directions and intensities. The outcomes in both cases are treated as height maps that translate to lines which define their shape. Then, one of the results is chosen to try the principle of curved rigid-foldable tubes.

Results from applied Point Spread Function on pixels at different scales (MATLAB+Rhino.Python) (increasing – top to bottom)
Results from applied Motion Function (MF) on pixels at different scales
(MATLAB+ Rhino.Python) (increasing – top to bottom)

At this point the obtained product contradicts with the idea of utilizing irradiated pixels for daily activities. The structures on top of them do not justify their purpose, so I will iterate back to the previous step by further developing the contracting-cells proposal.

Converging-limited foldability

I tried to explore some of the possibilities from folding a piece of paper while constraining with various “levels of freedom”. The following diagrams explain the results from different limiting points and how they can be reproduced with one foldable element. By introducing the limiting plane the original constraining points are removed but the folding results are attained.

Clustered results

Quite often architects are challenged with the need to analyze large sets of data in the design process. However, there is a lack of defined approaches and therefore in most cases detailed analyses are avoided. Through this project I tried to observe a fraction of what could be used as a valuable assessment tool in various projects. Clustering approaches are not uncommon in different fields when in need to observe data, but in architecture these have been poorly investigated. I have used the MATLAB programming language developed by MathWorks to investigate the potential for architectural use.

This is a brief description of the steps in the process:

1. Looking at the height maps as a set of pixels containing height data and clustering with kmeans. (This is an unsupervised learning technique that does the analysis without predefined criteria.) The results give groups of heights that share similar ‘intensity’.

2. A region of interest is selected with clustering division at k=5.

3. Radiation maps of the site are generated using Ladybug. (Different relevant maps or parameters can be used for evaluation depending on the requirements.)

4. k-means clustering is applied on a radiation map. The points that satisfy values above a defined threshold are selected and interpolated to the previously defined region of interest. This gives points that satisfy certain irradiation criteria within the specified height region.

5. New clusters are created in order to define optimal building areas and building shapes are defined at locations where the points satisfy certain density.

The results from the steps are shown in the following isometric drawing.

An experiment with varying k-number values in the kmeans clustering was performed and the results can be observed in the short animation. For values above 200 it is difficult to read the information from the resulting images, but lower k-numbers can give different levels of detail depending on the requirements of the user.