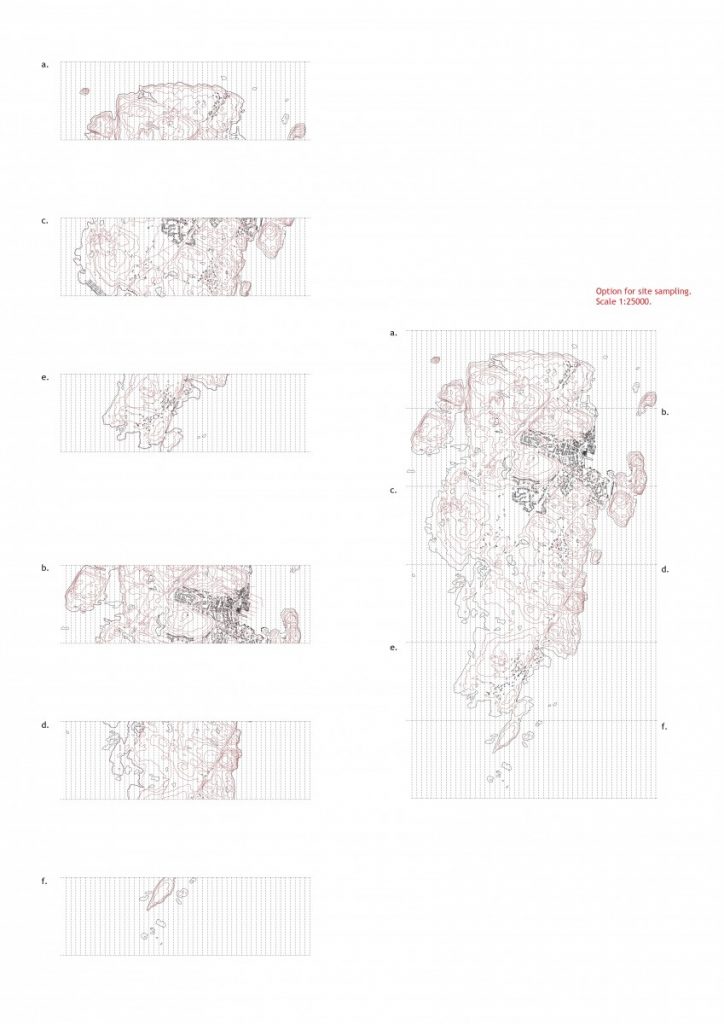
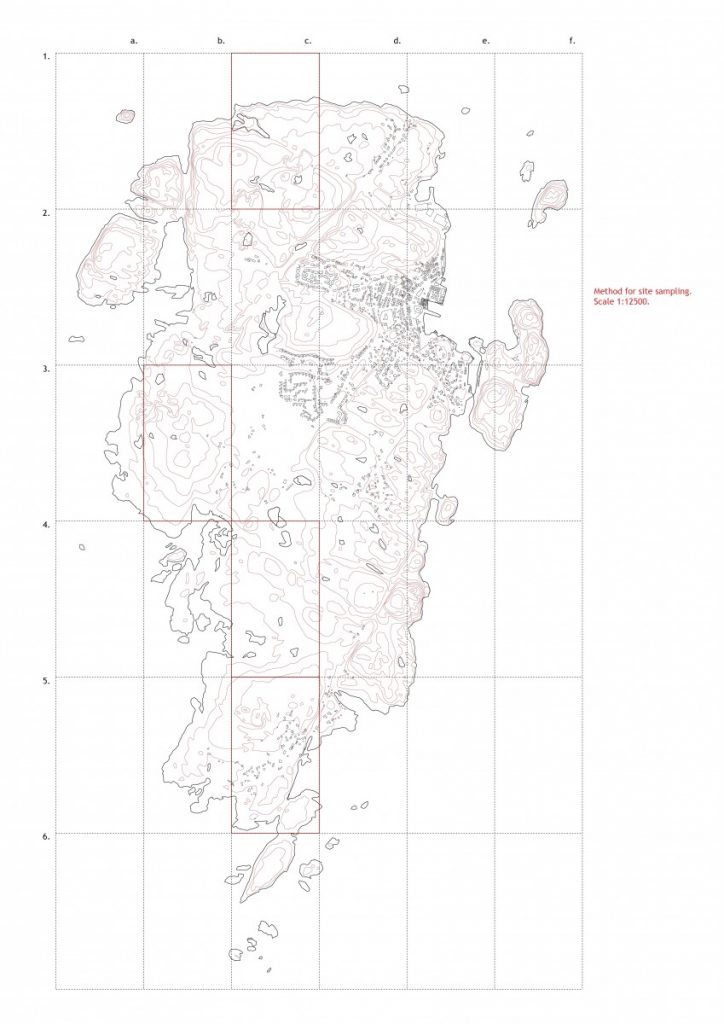
Moving on from the last pin-up I needed a better management strategy for the site data. When the robot reads and responds to the site it needs to be at a scale that the data is useable and realistic for the architectural design to be implemented. Providing a grid system allowed a reading of the entire terrain in greater detail where each grid tile can be blown up and analysed. Consideration was also taken for the dimensions of a manageable testing area for repeated demonstrations and data collection. Below are two possible methods of grid reading of the site. The maps were sampled at 1:500 scale with the second method of grid division.
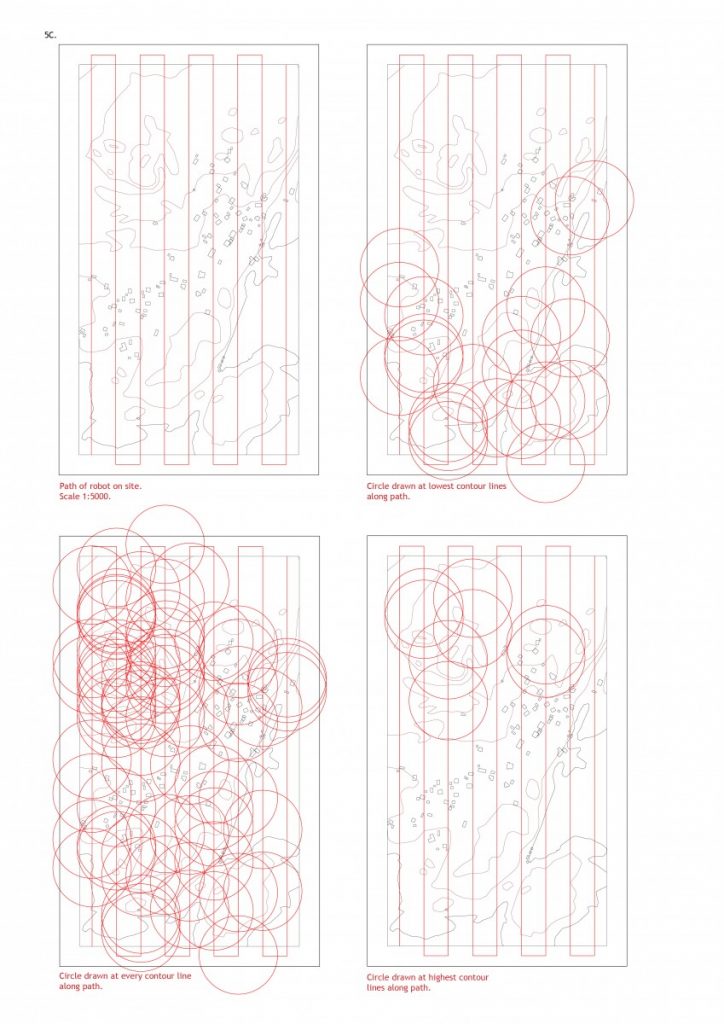
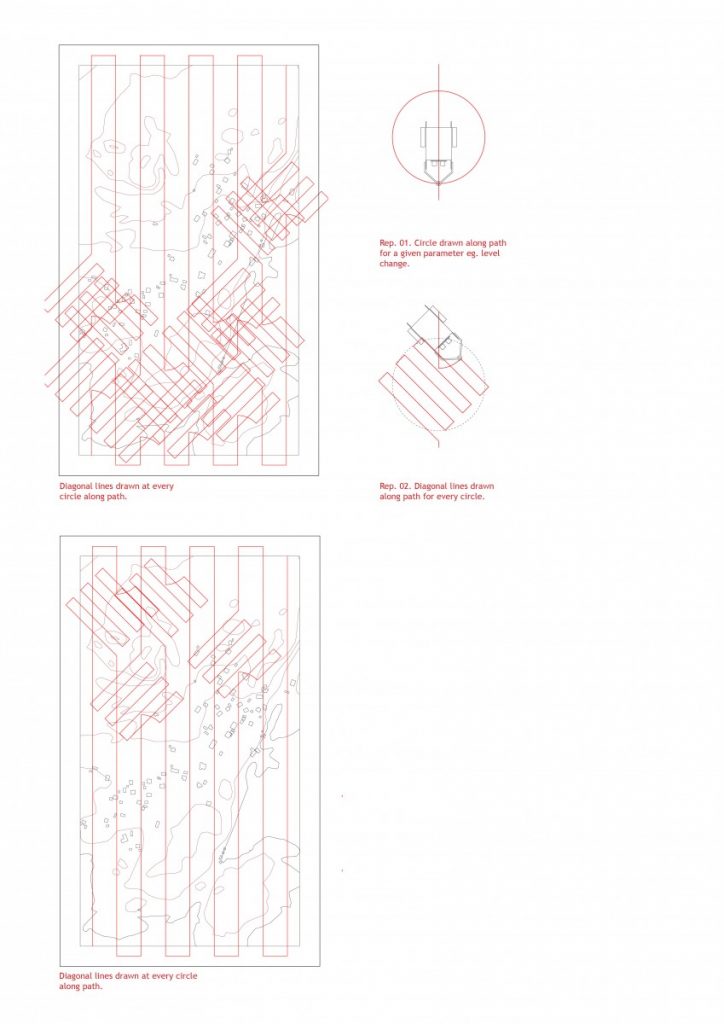
The robot has a narrow range of testing limited to its line and ultrasonic sensors. This provides a linear path of testing at 1cm intervals on the sample map which would be every 50metres in real life. This gives a dimension and scale to any output that will be collected. In the simulation drawings, the robot is to respond to the changes in height at any level changes, changes at the highest and lowest areas. The output is a full 360 rotation of the robot leaving circles as the response. The robot is allowed to respond to its generated data again and draw diagonal lines at a 45 degree angle at every circle. This then gives a criss cross of linear data that the building system of precast members could be assembled upon.