28 grids later.

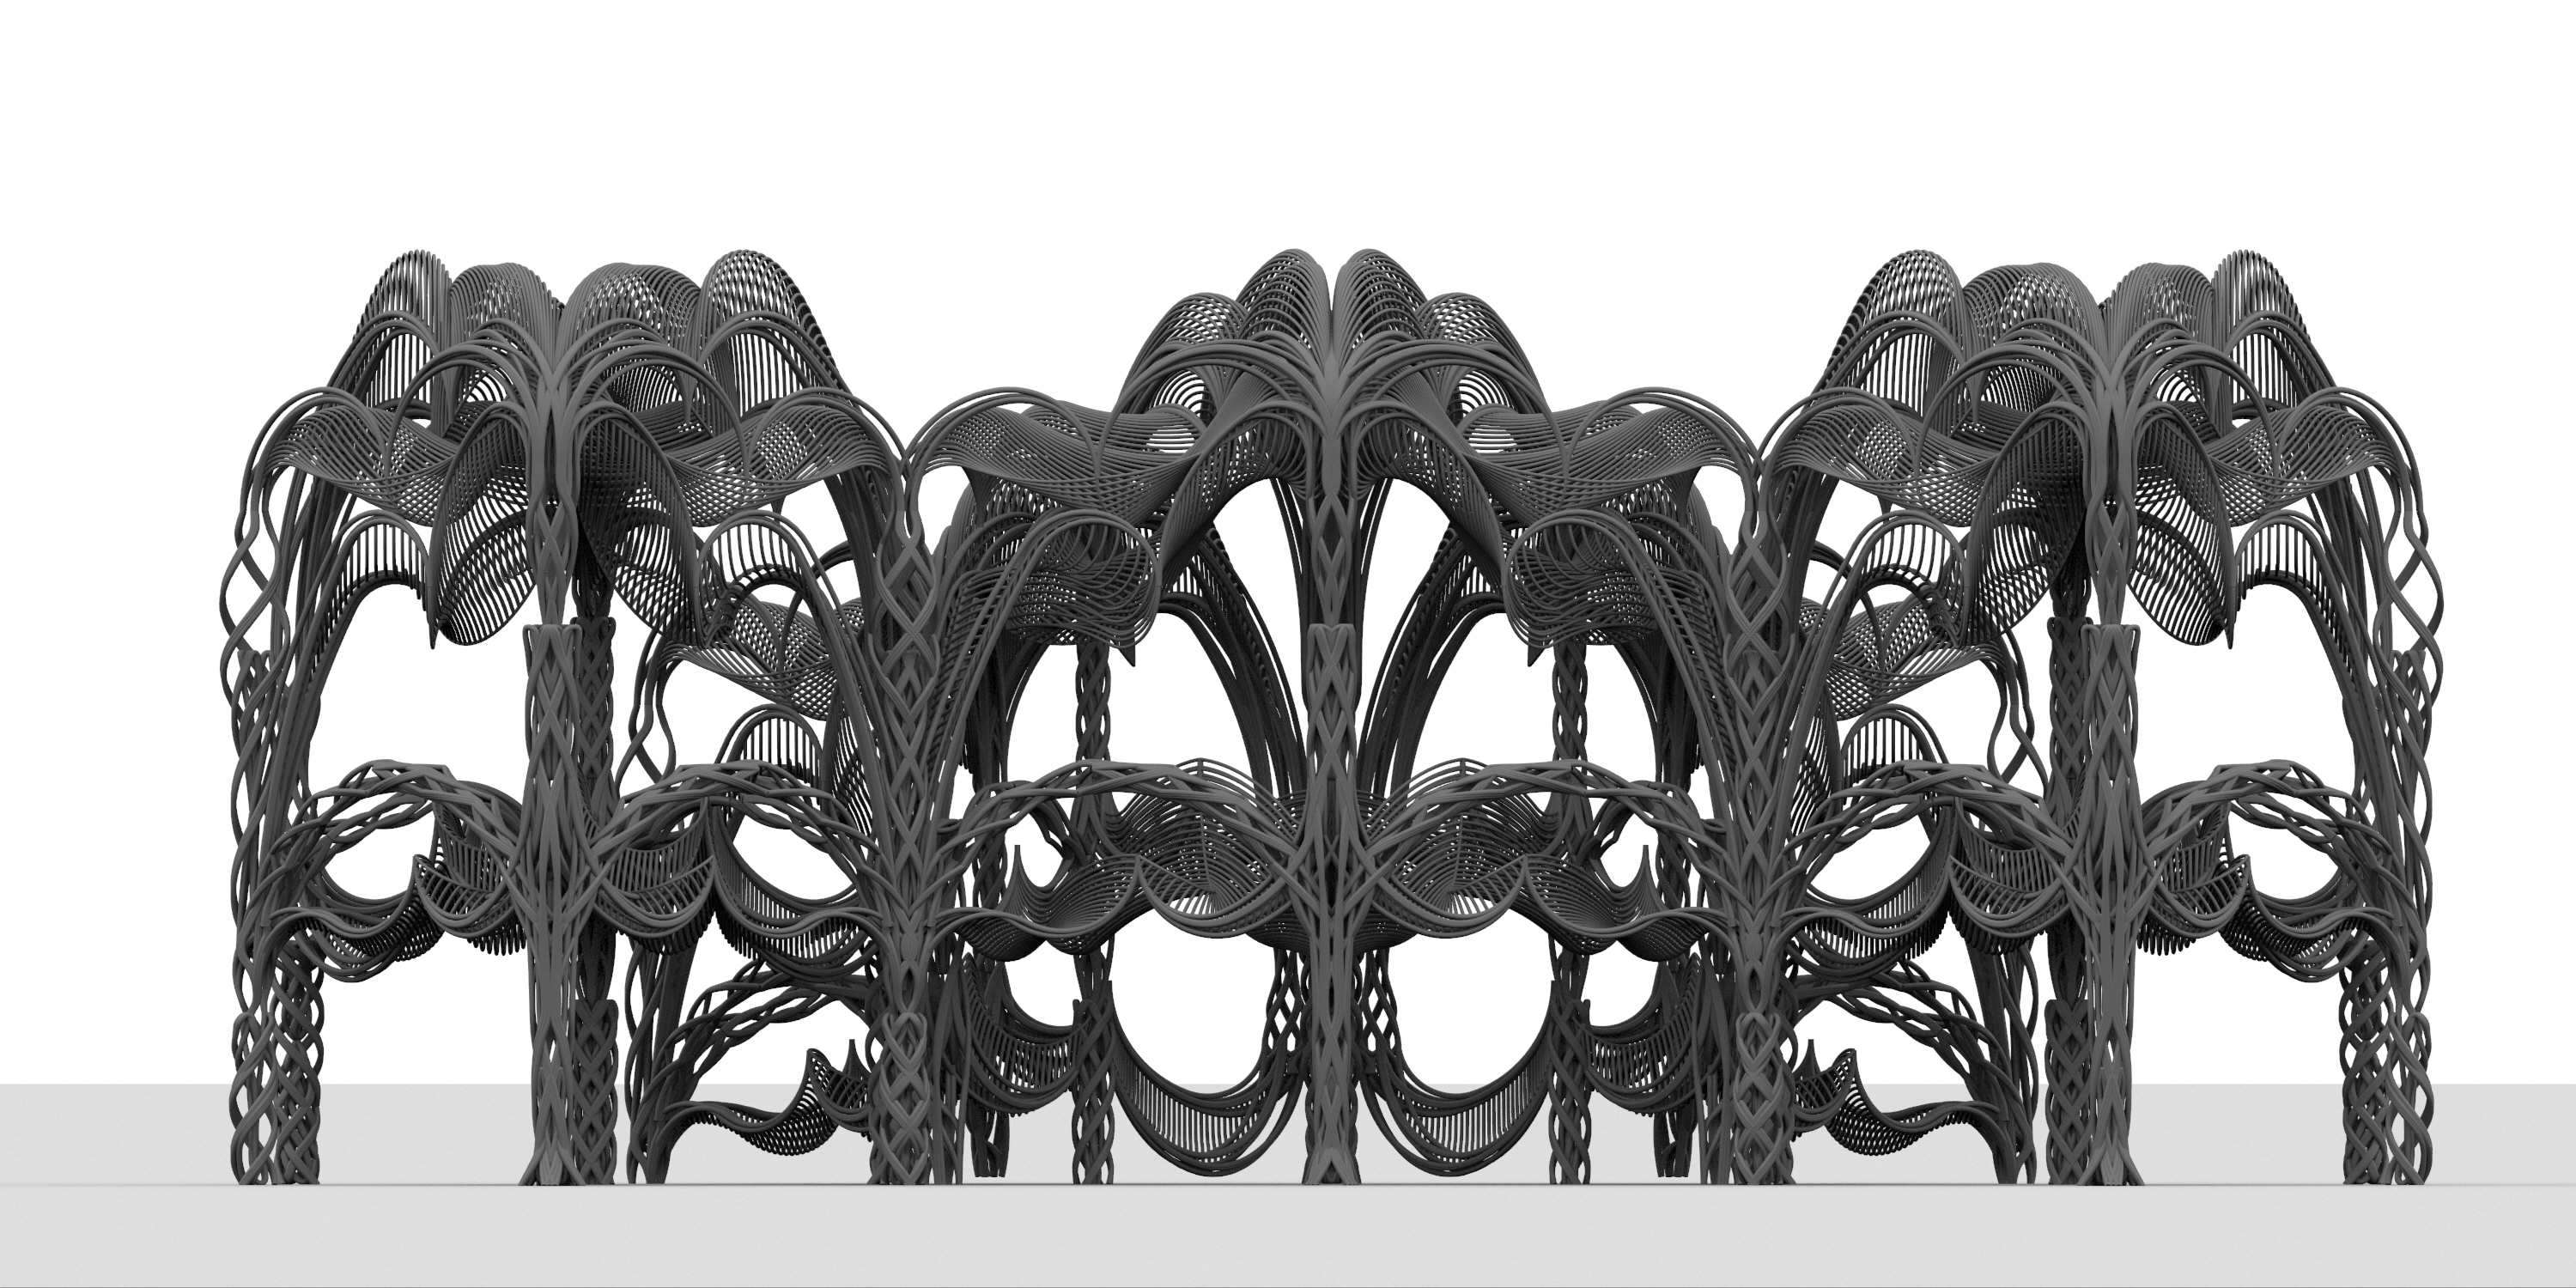
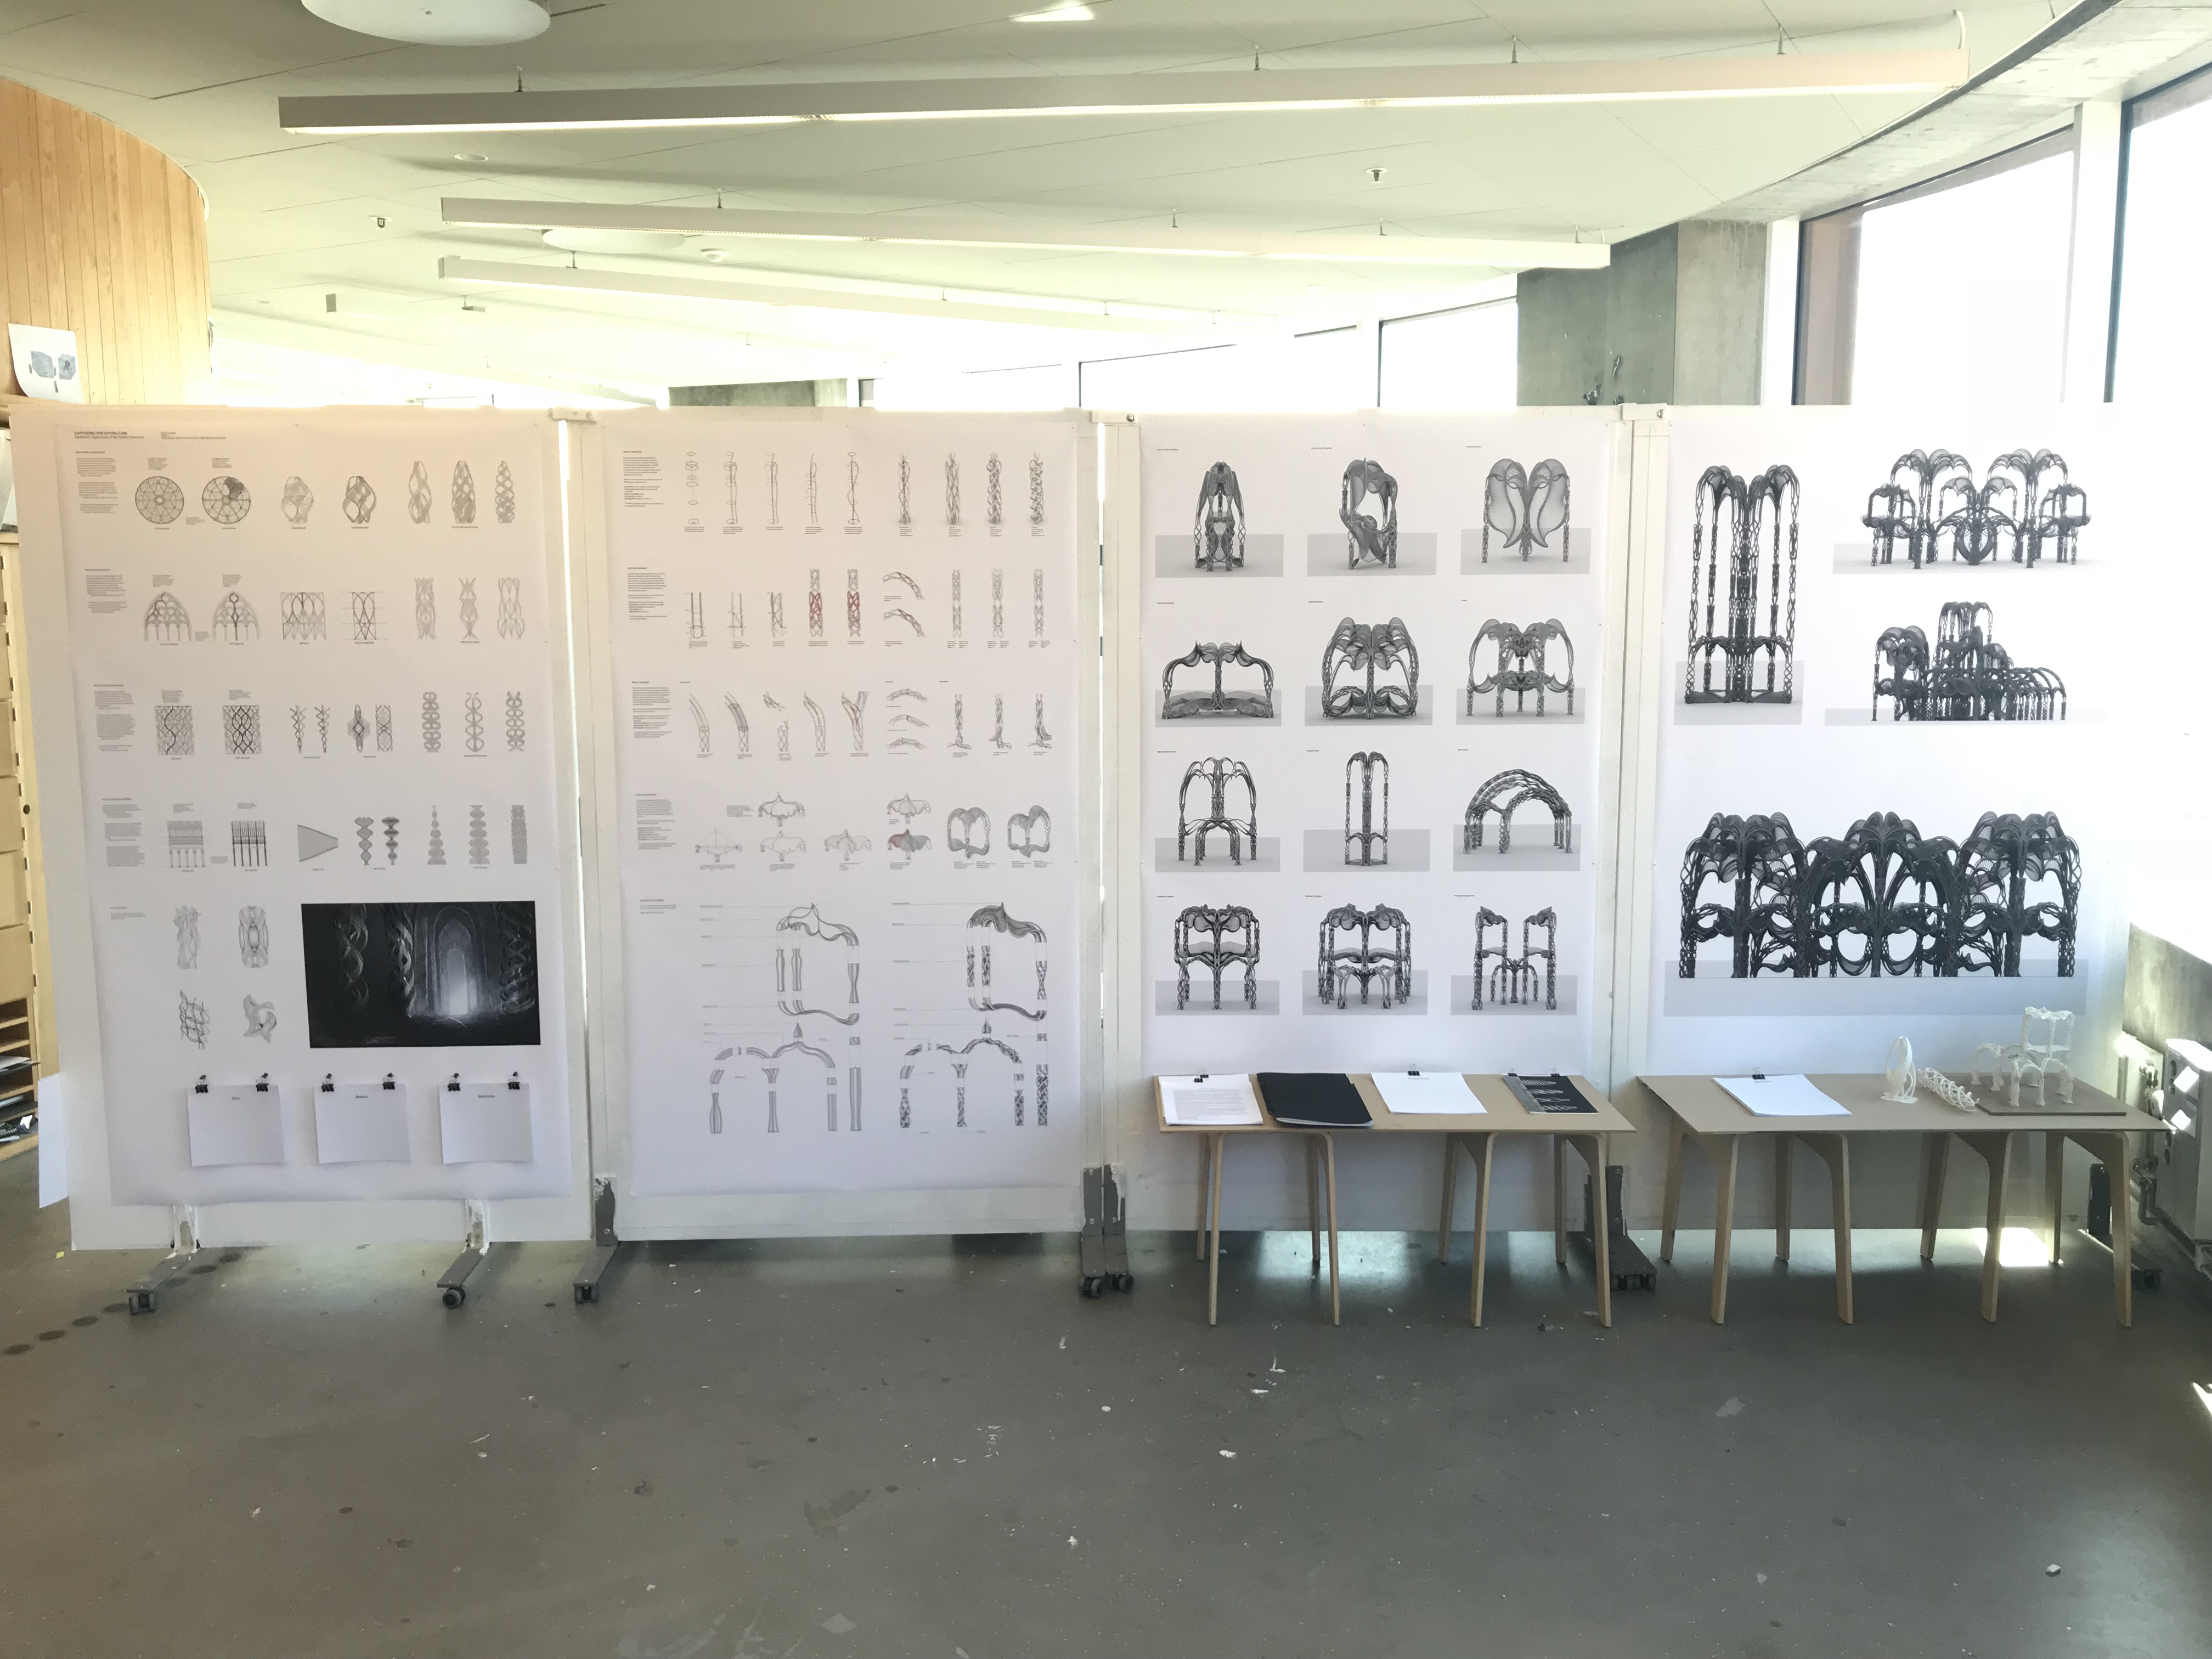
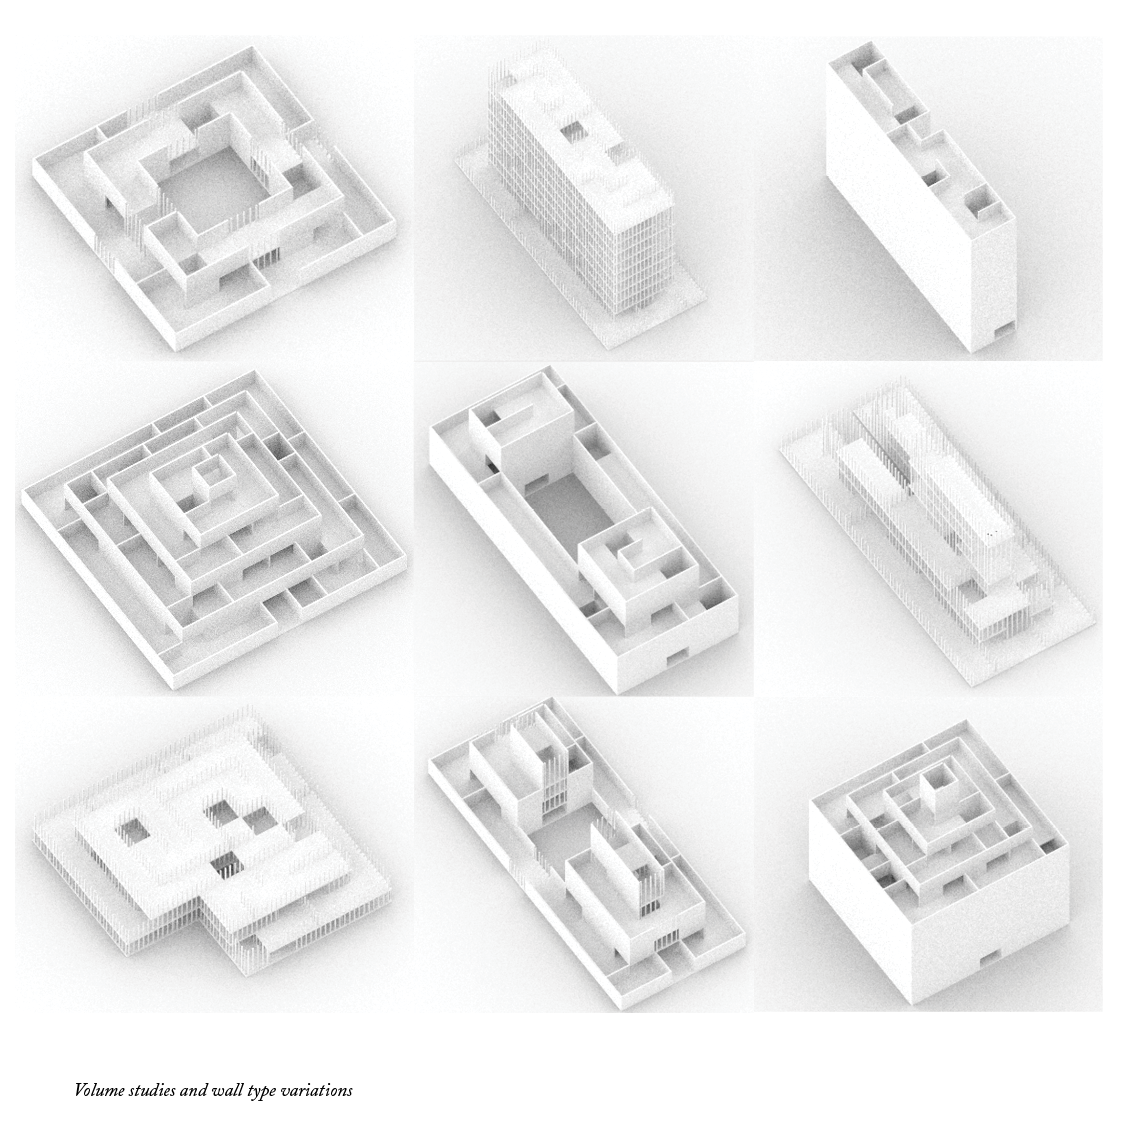
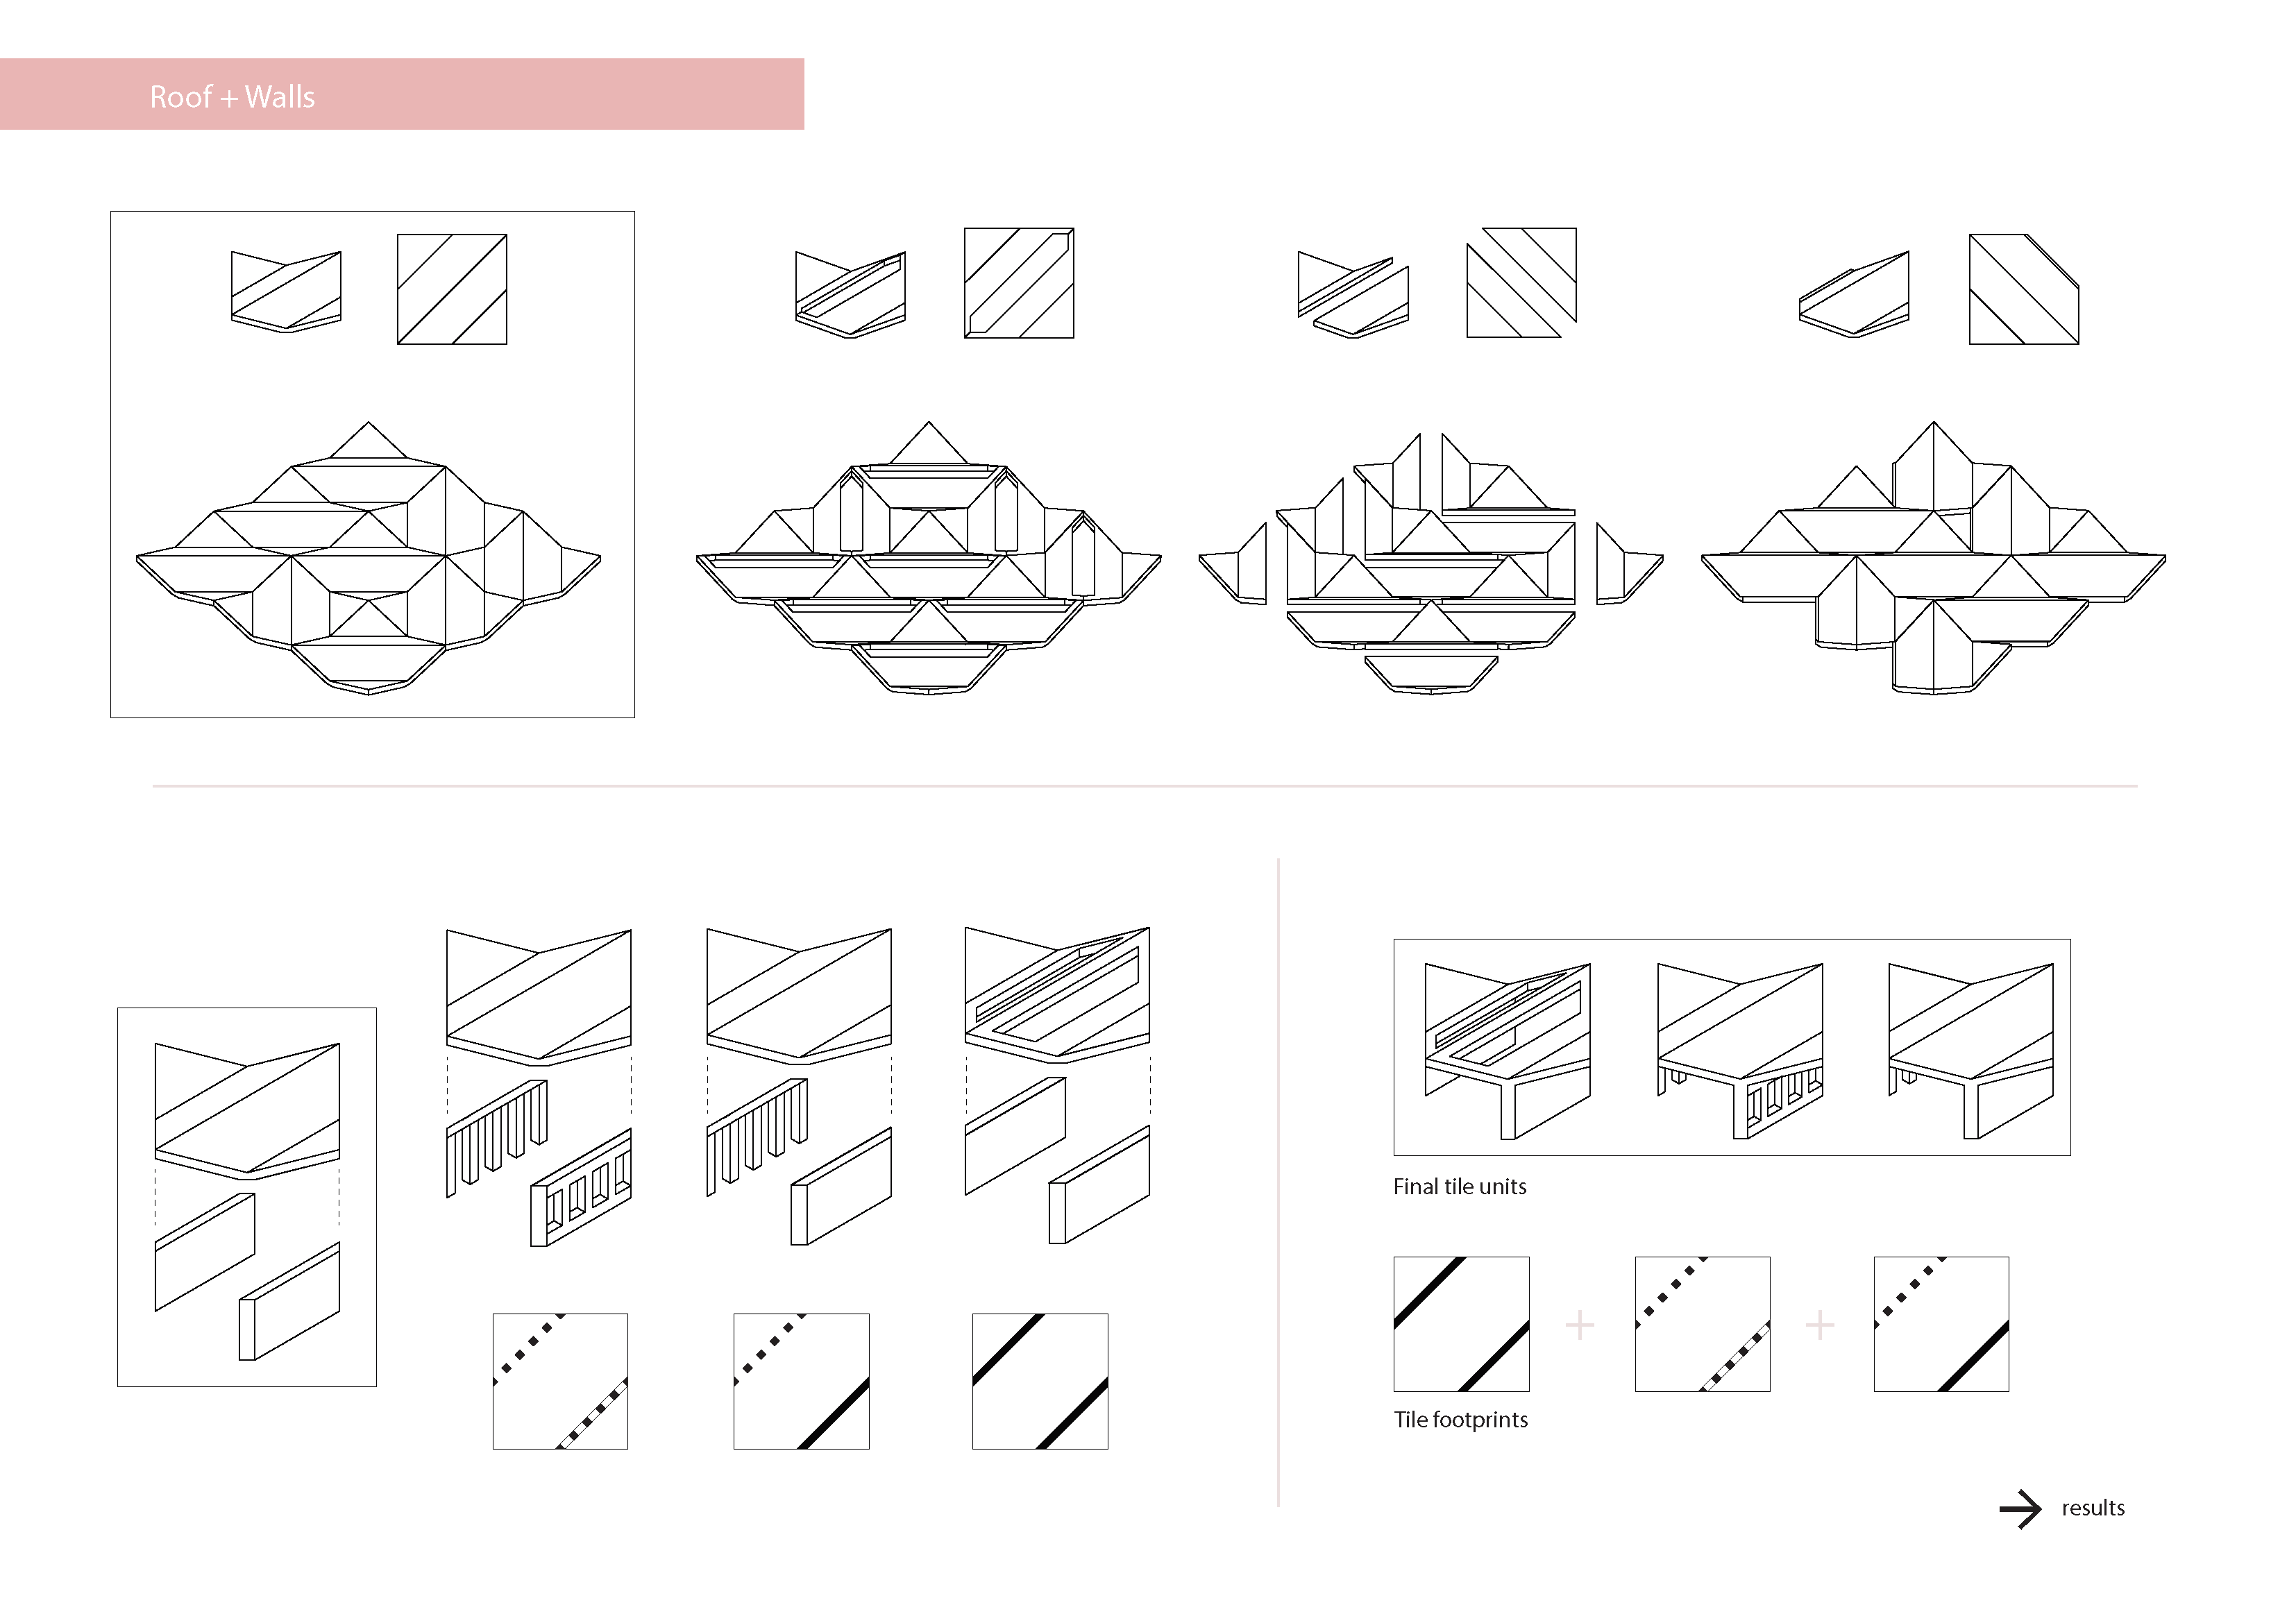
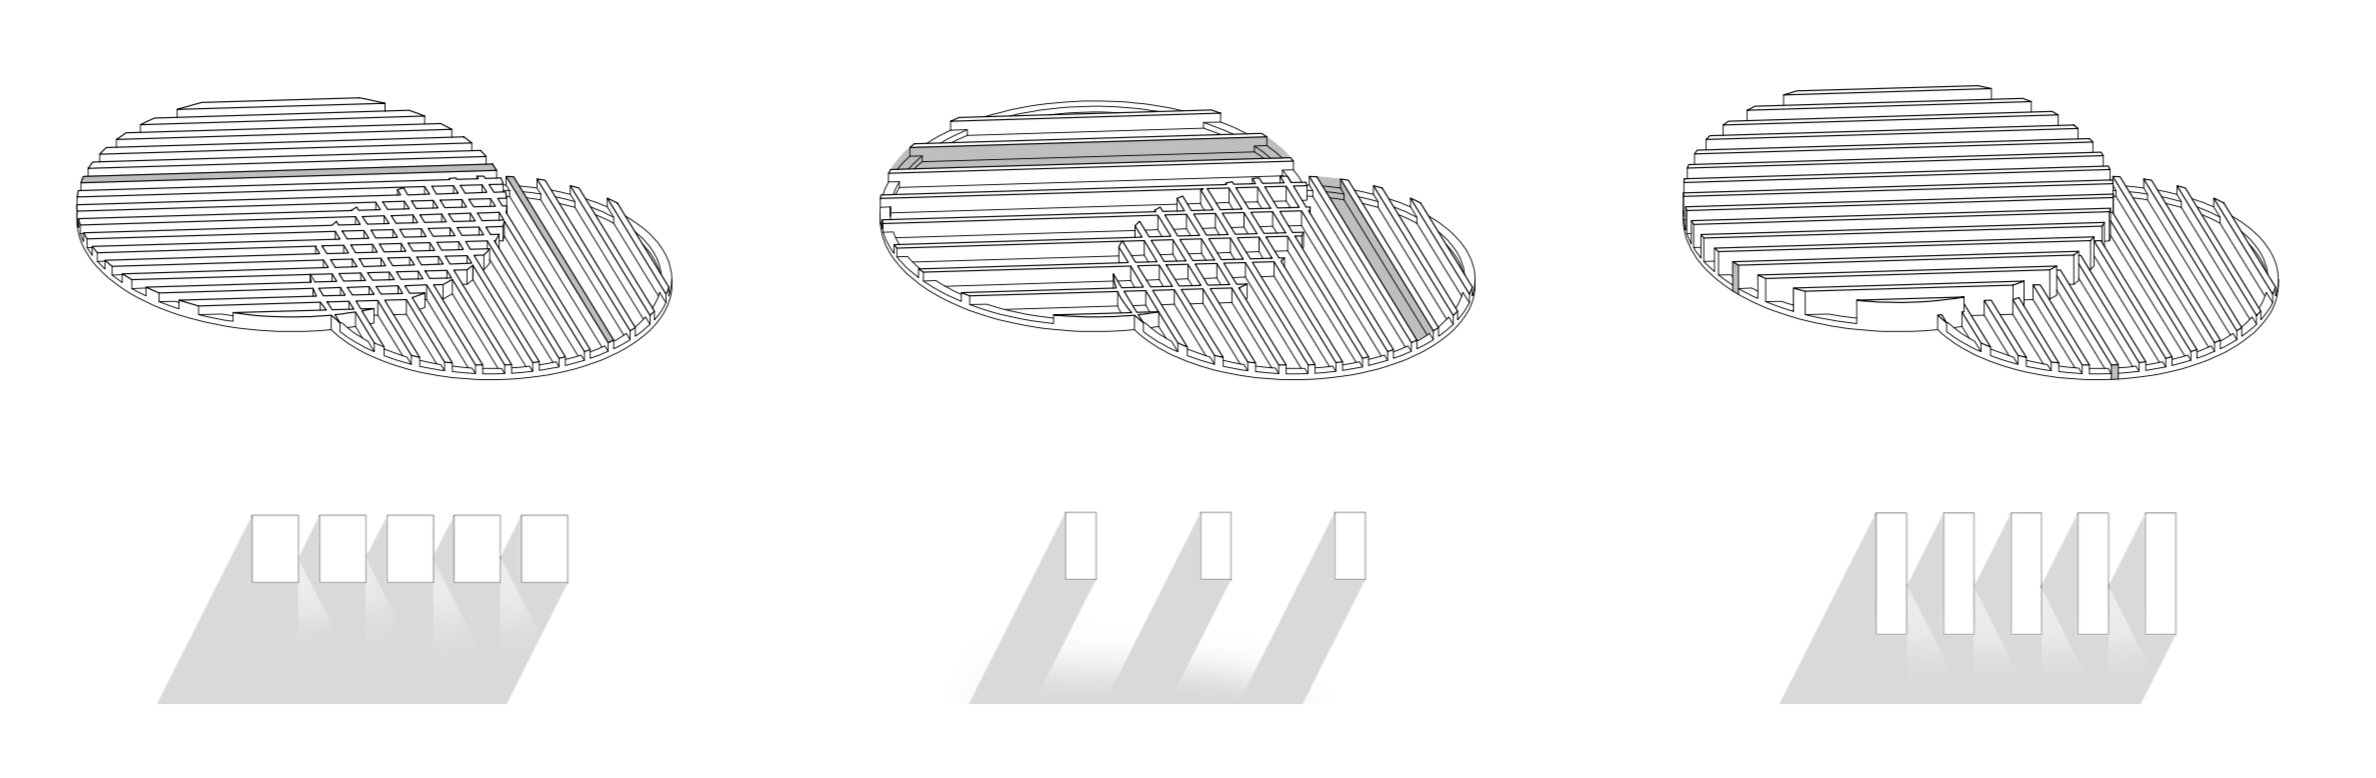
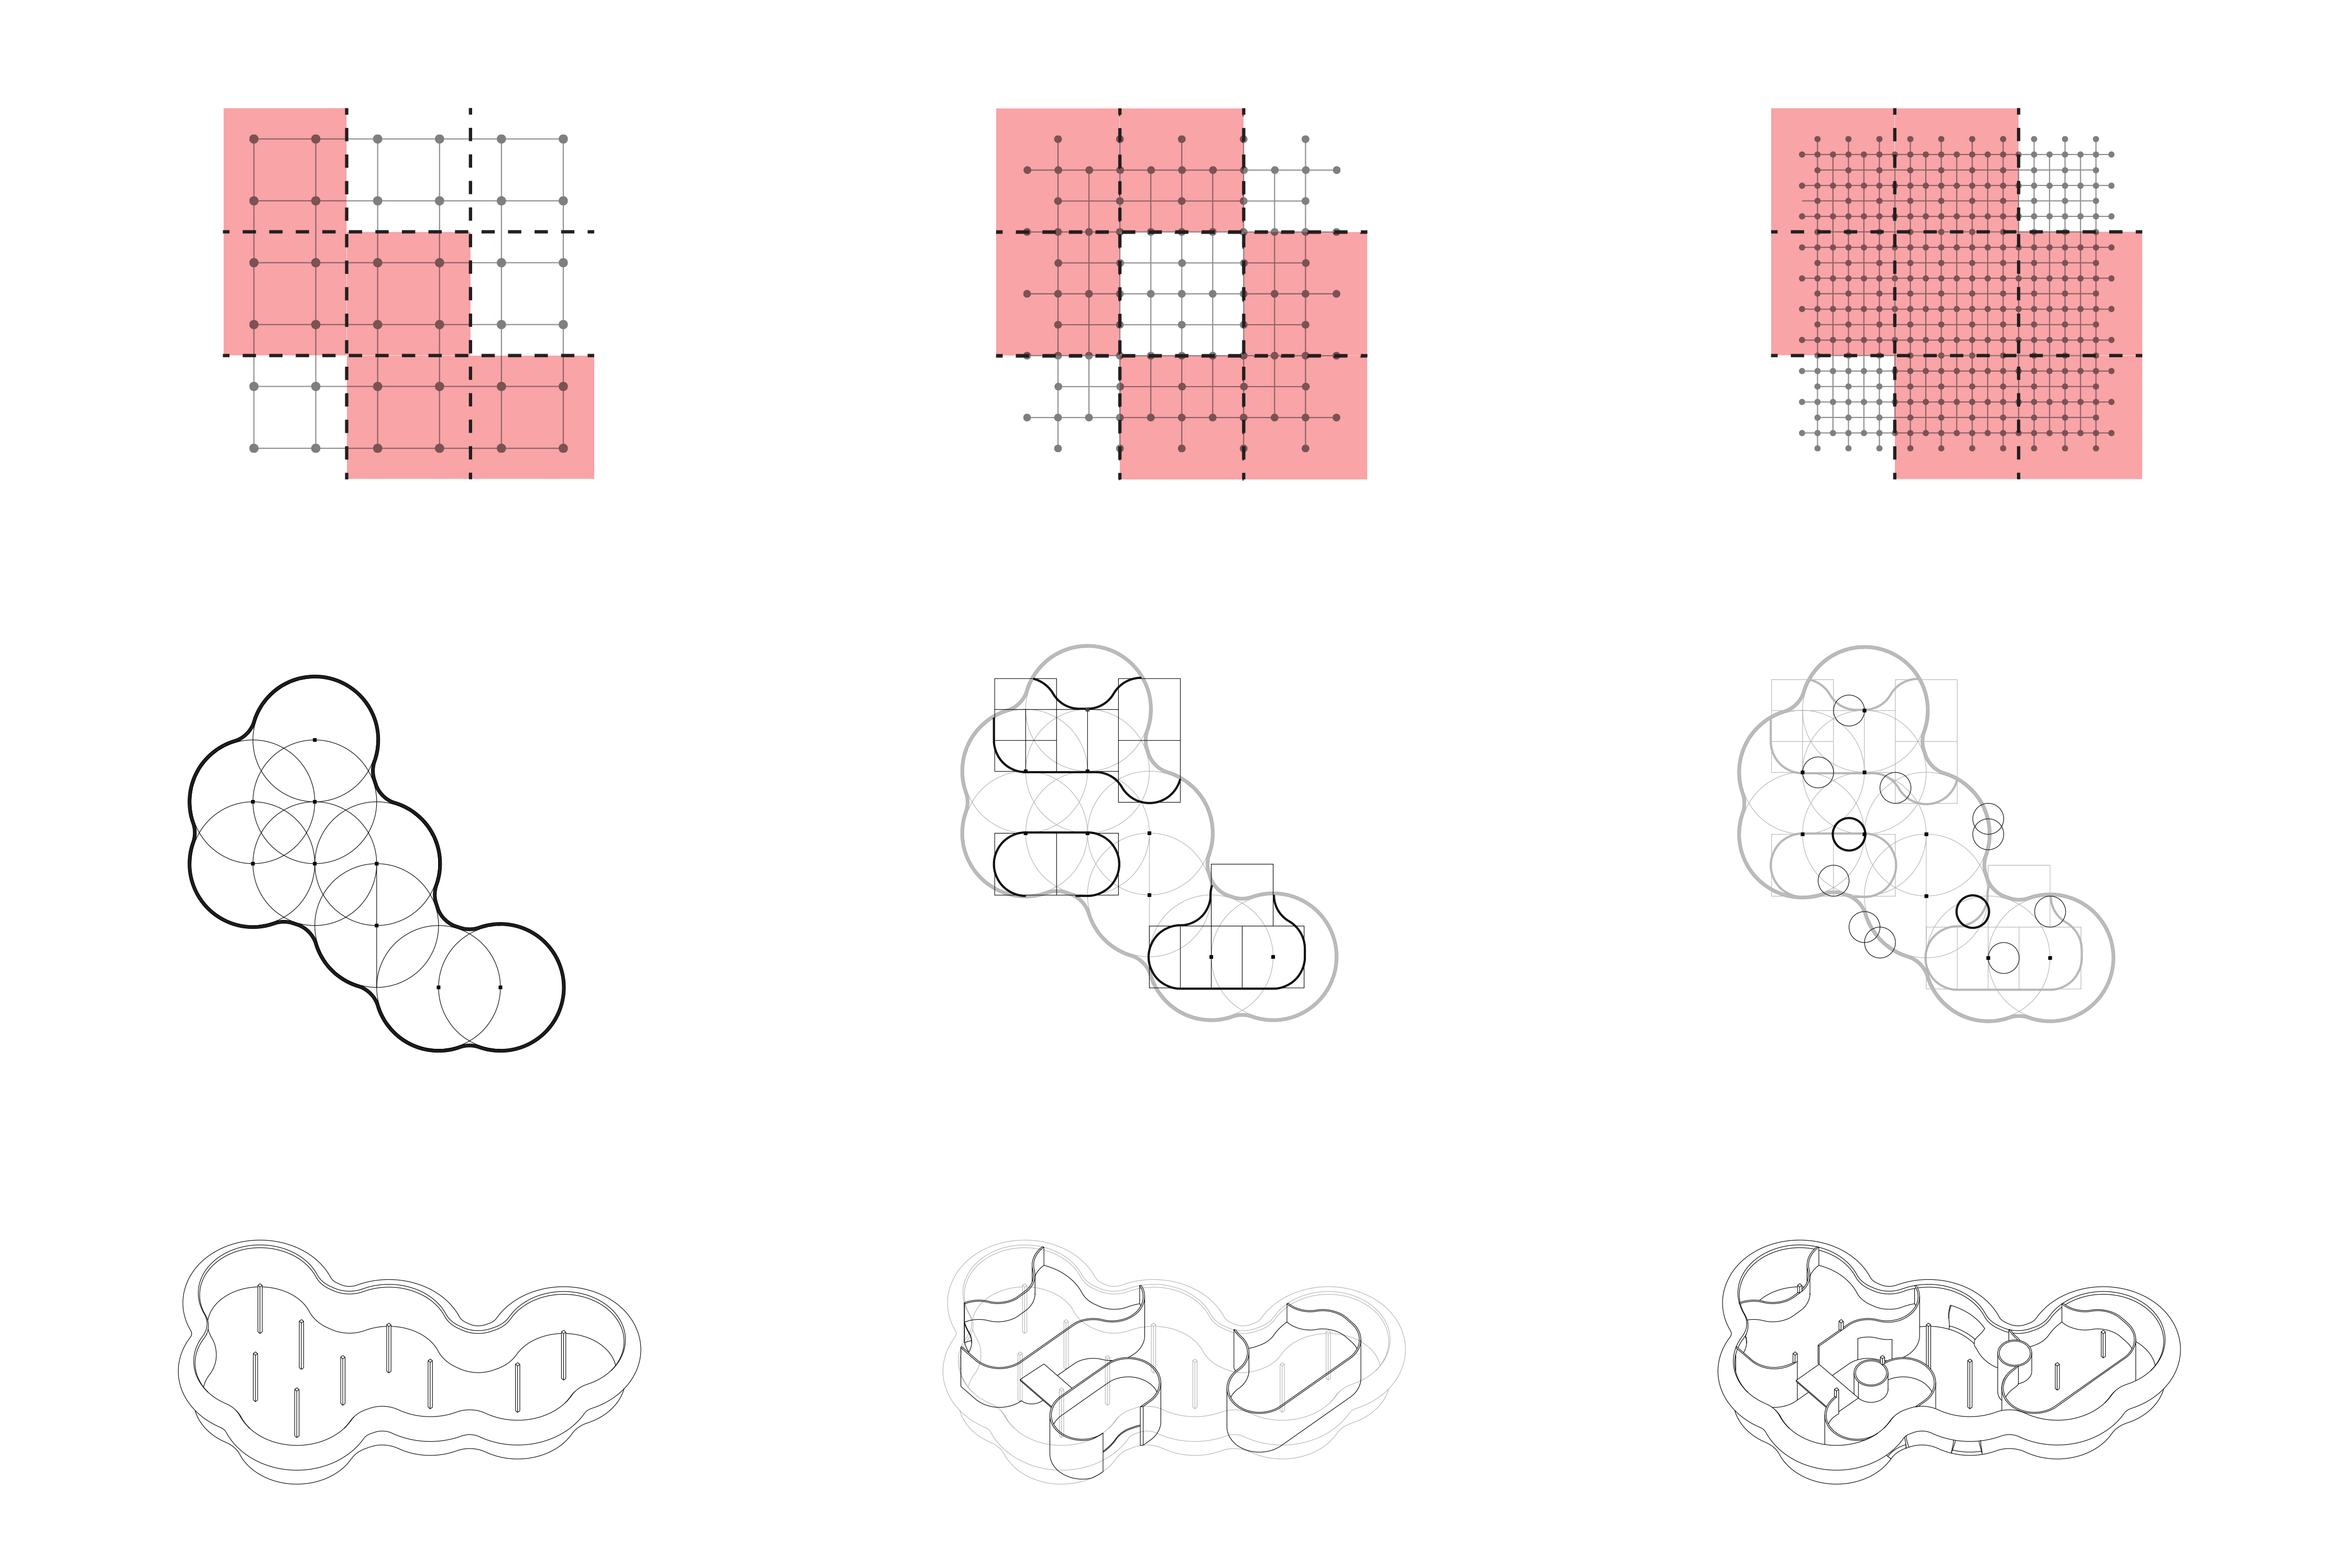
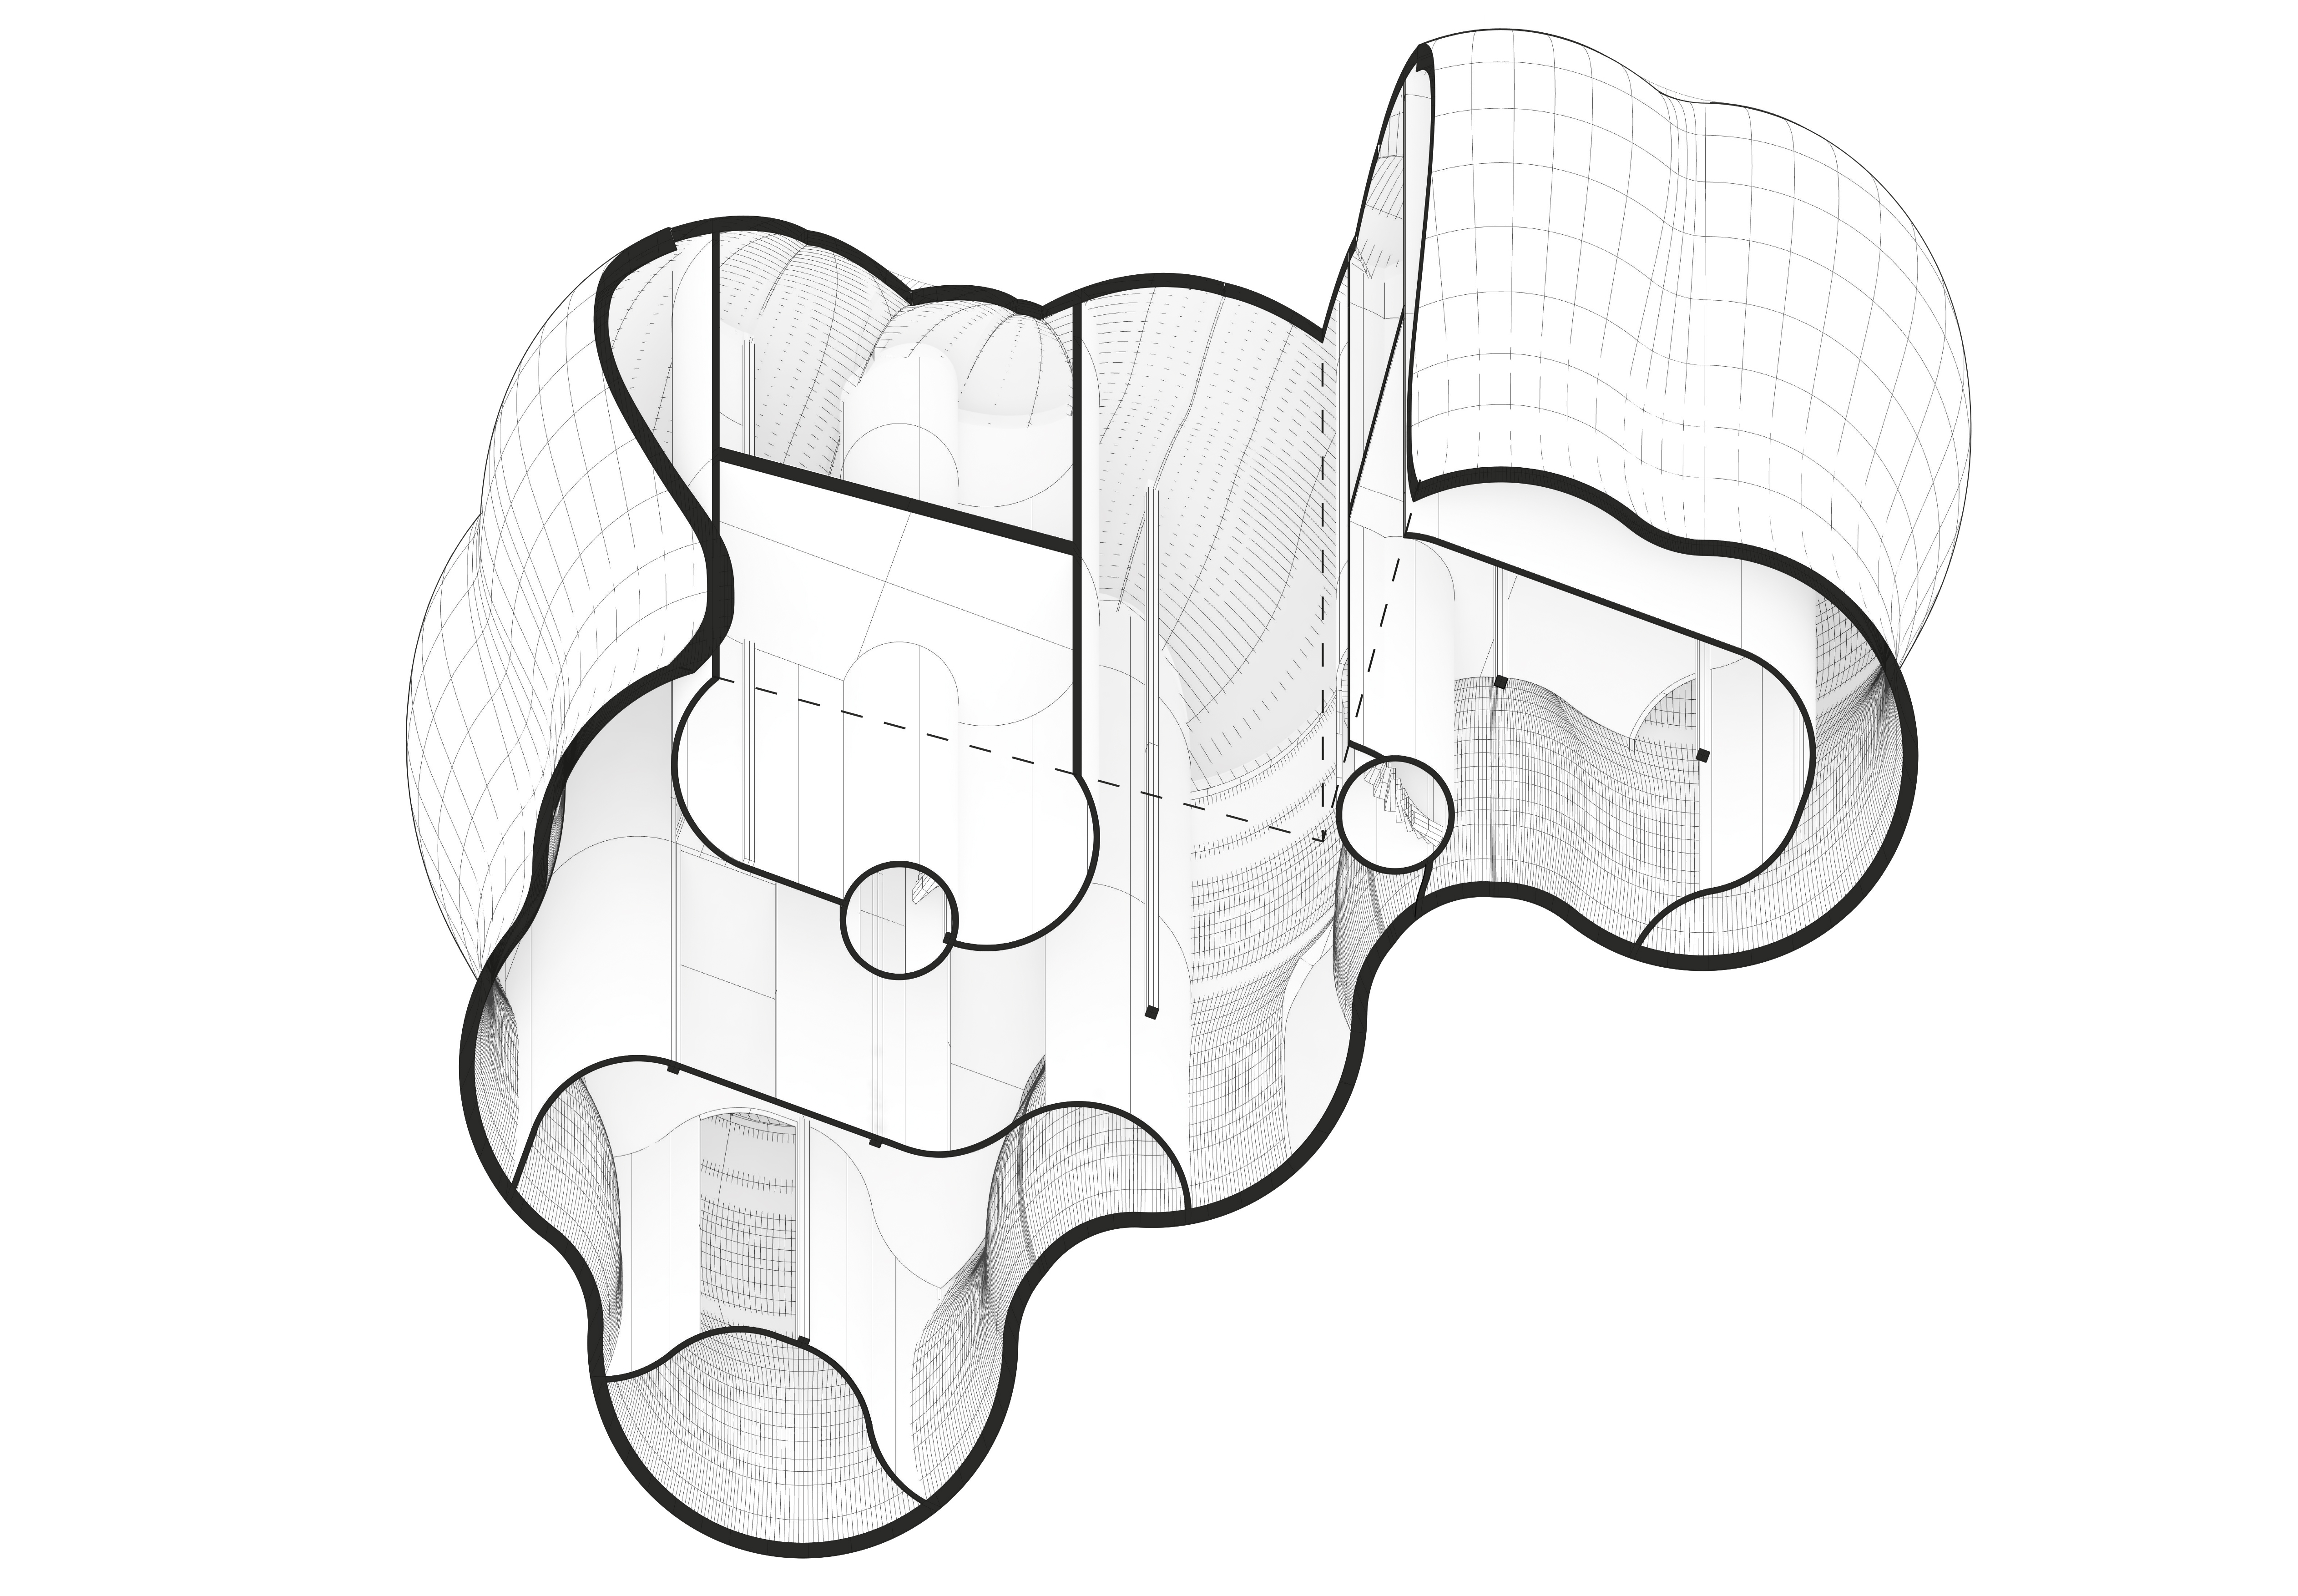
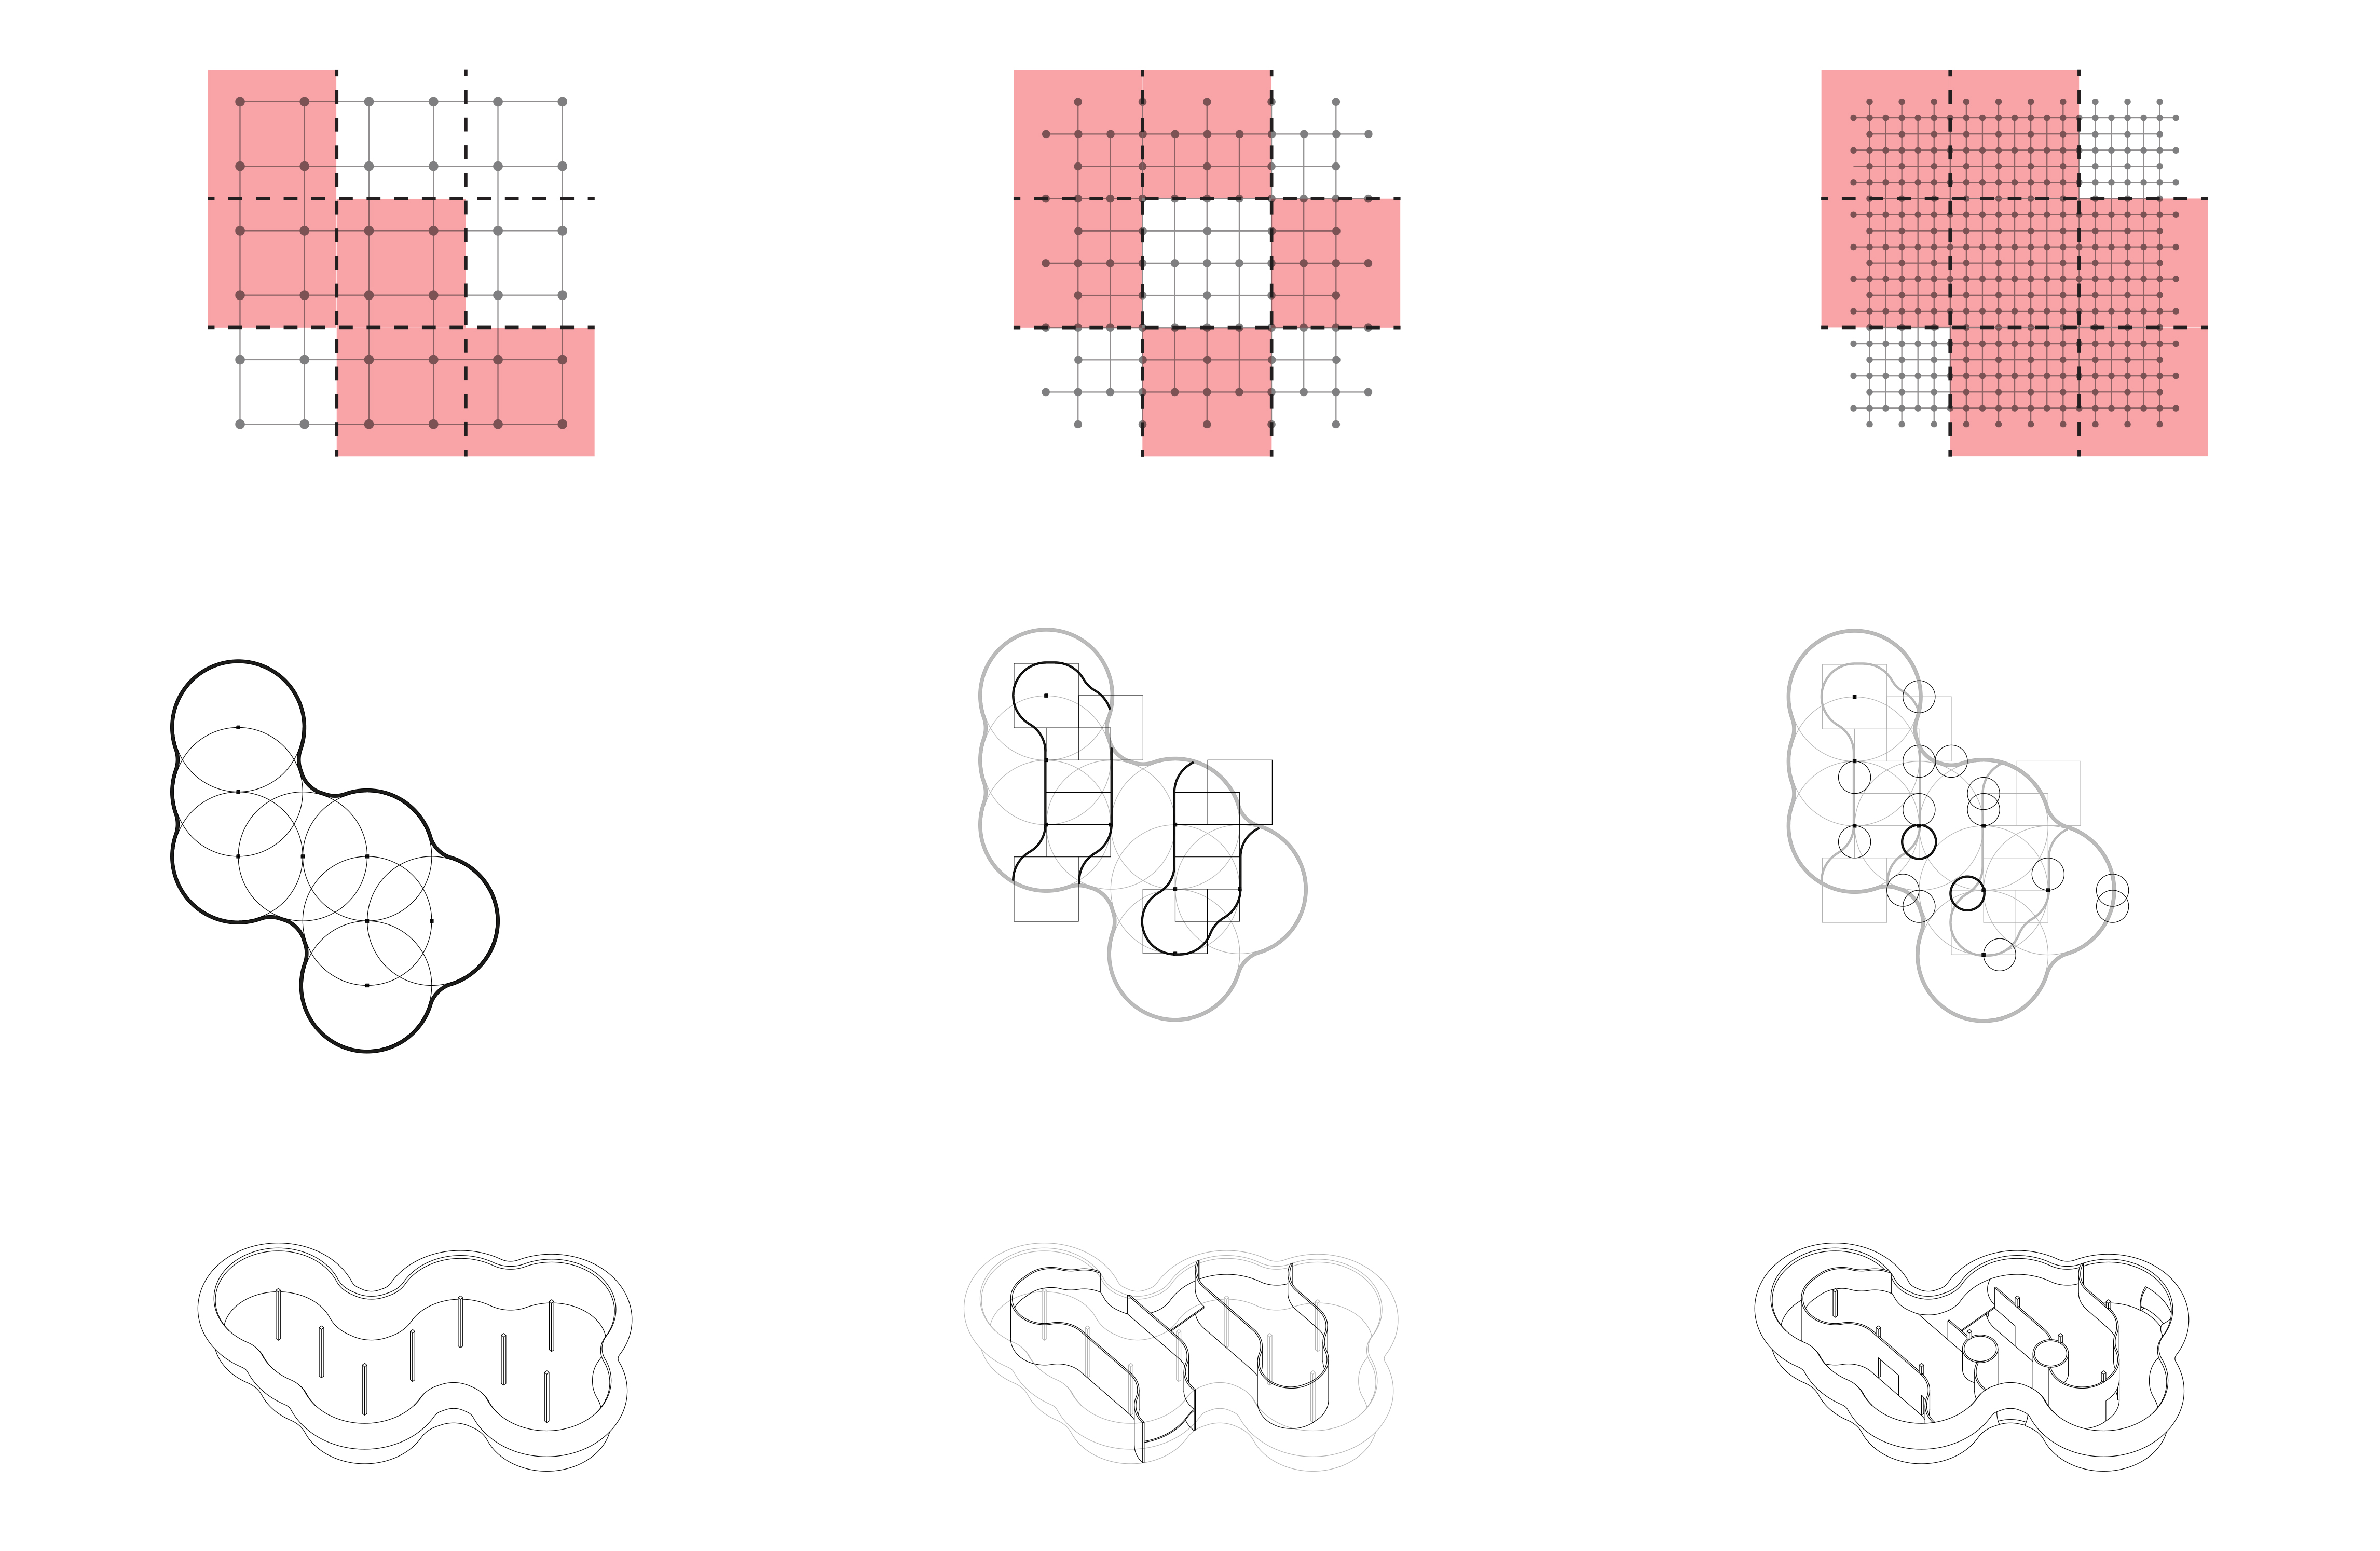
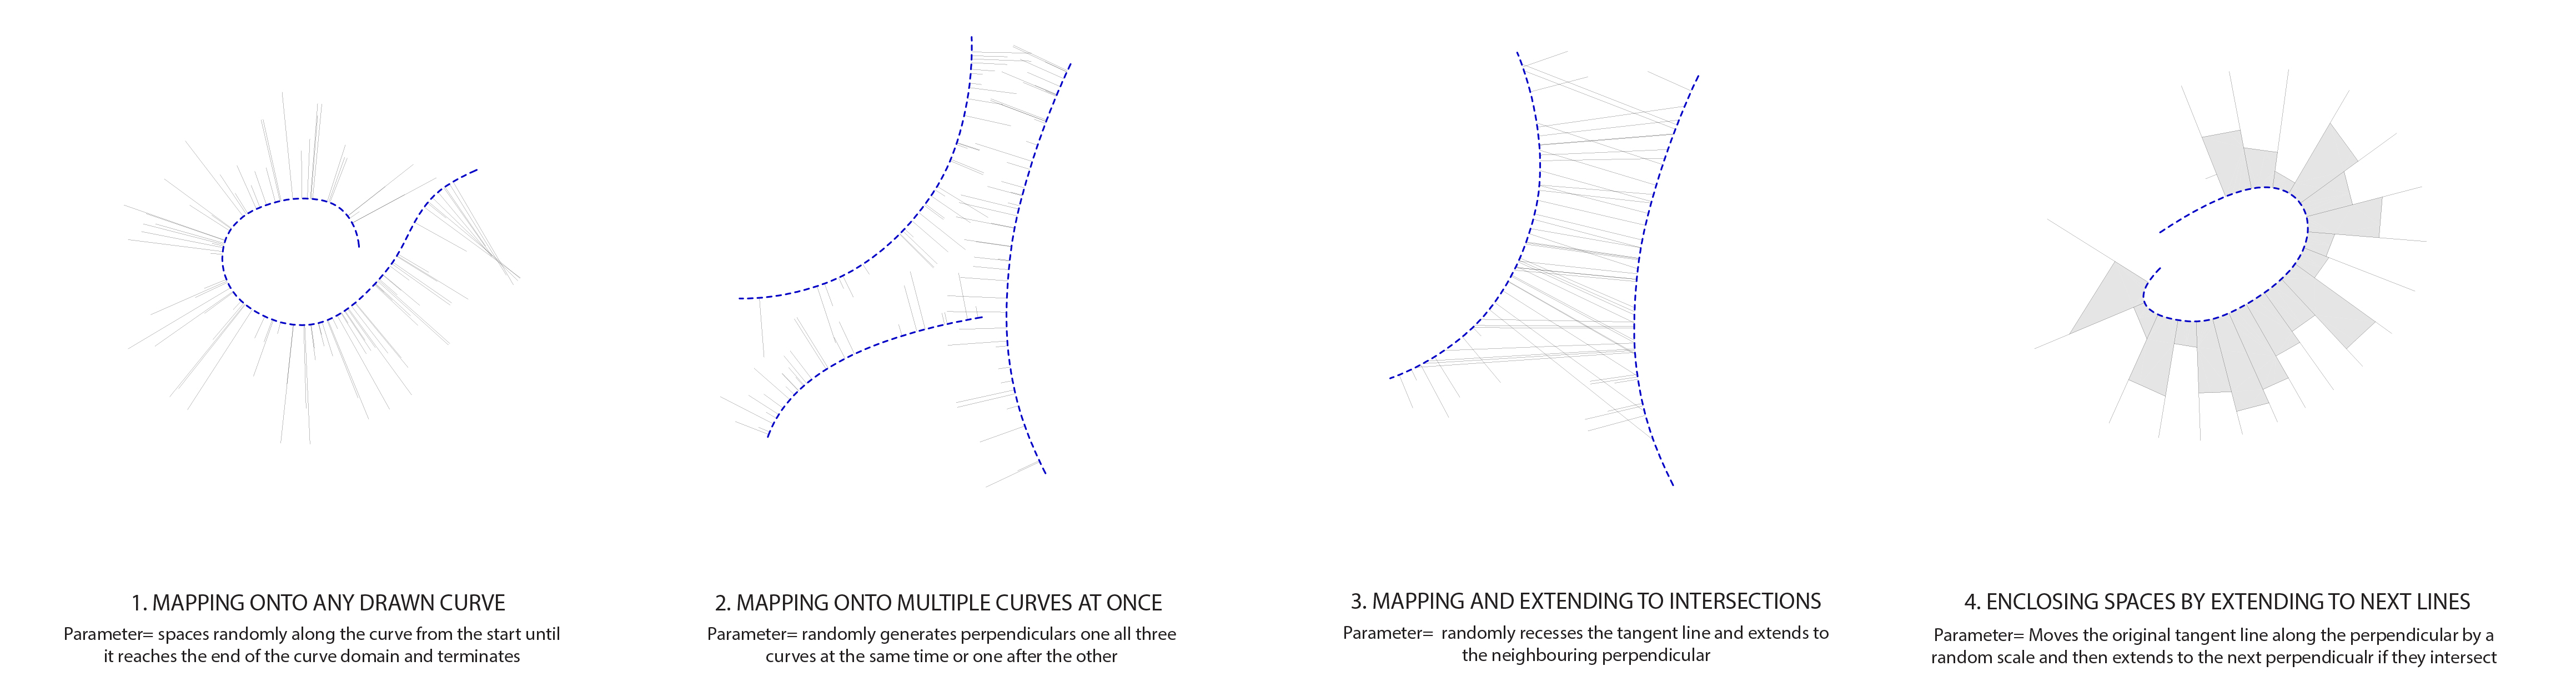
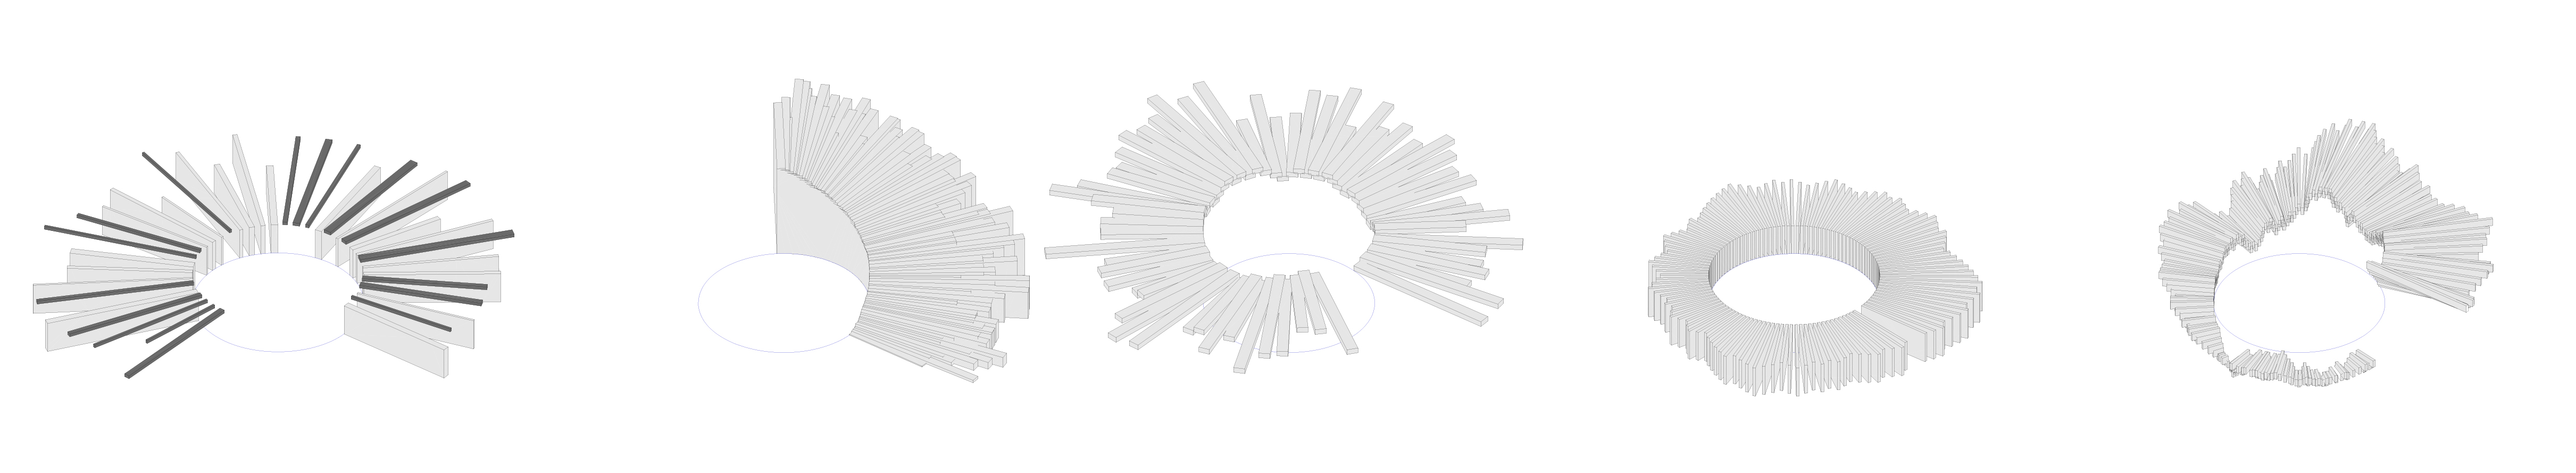
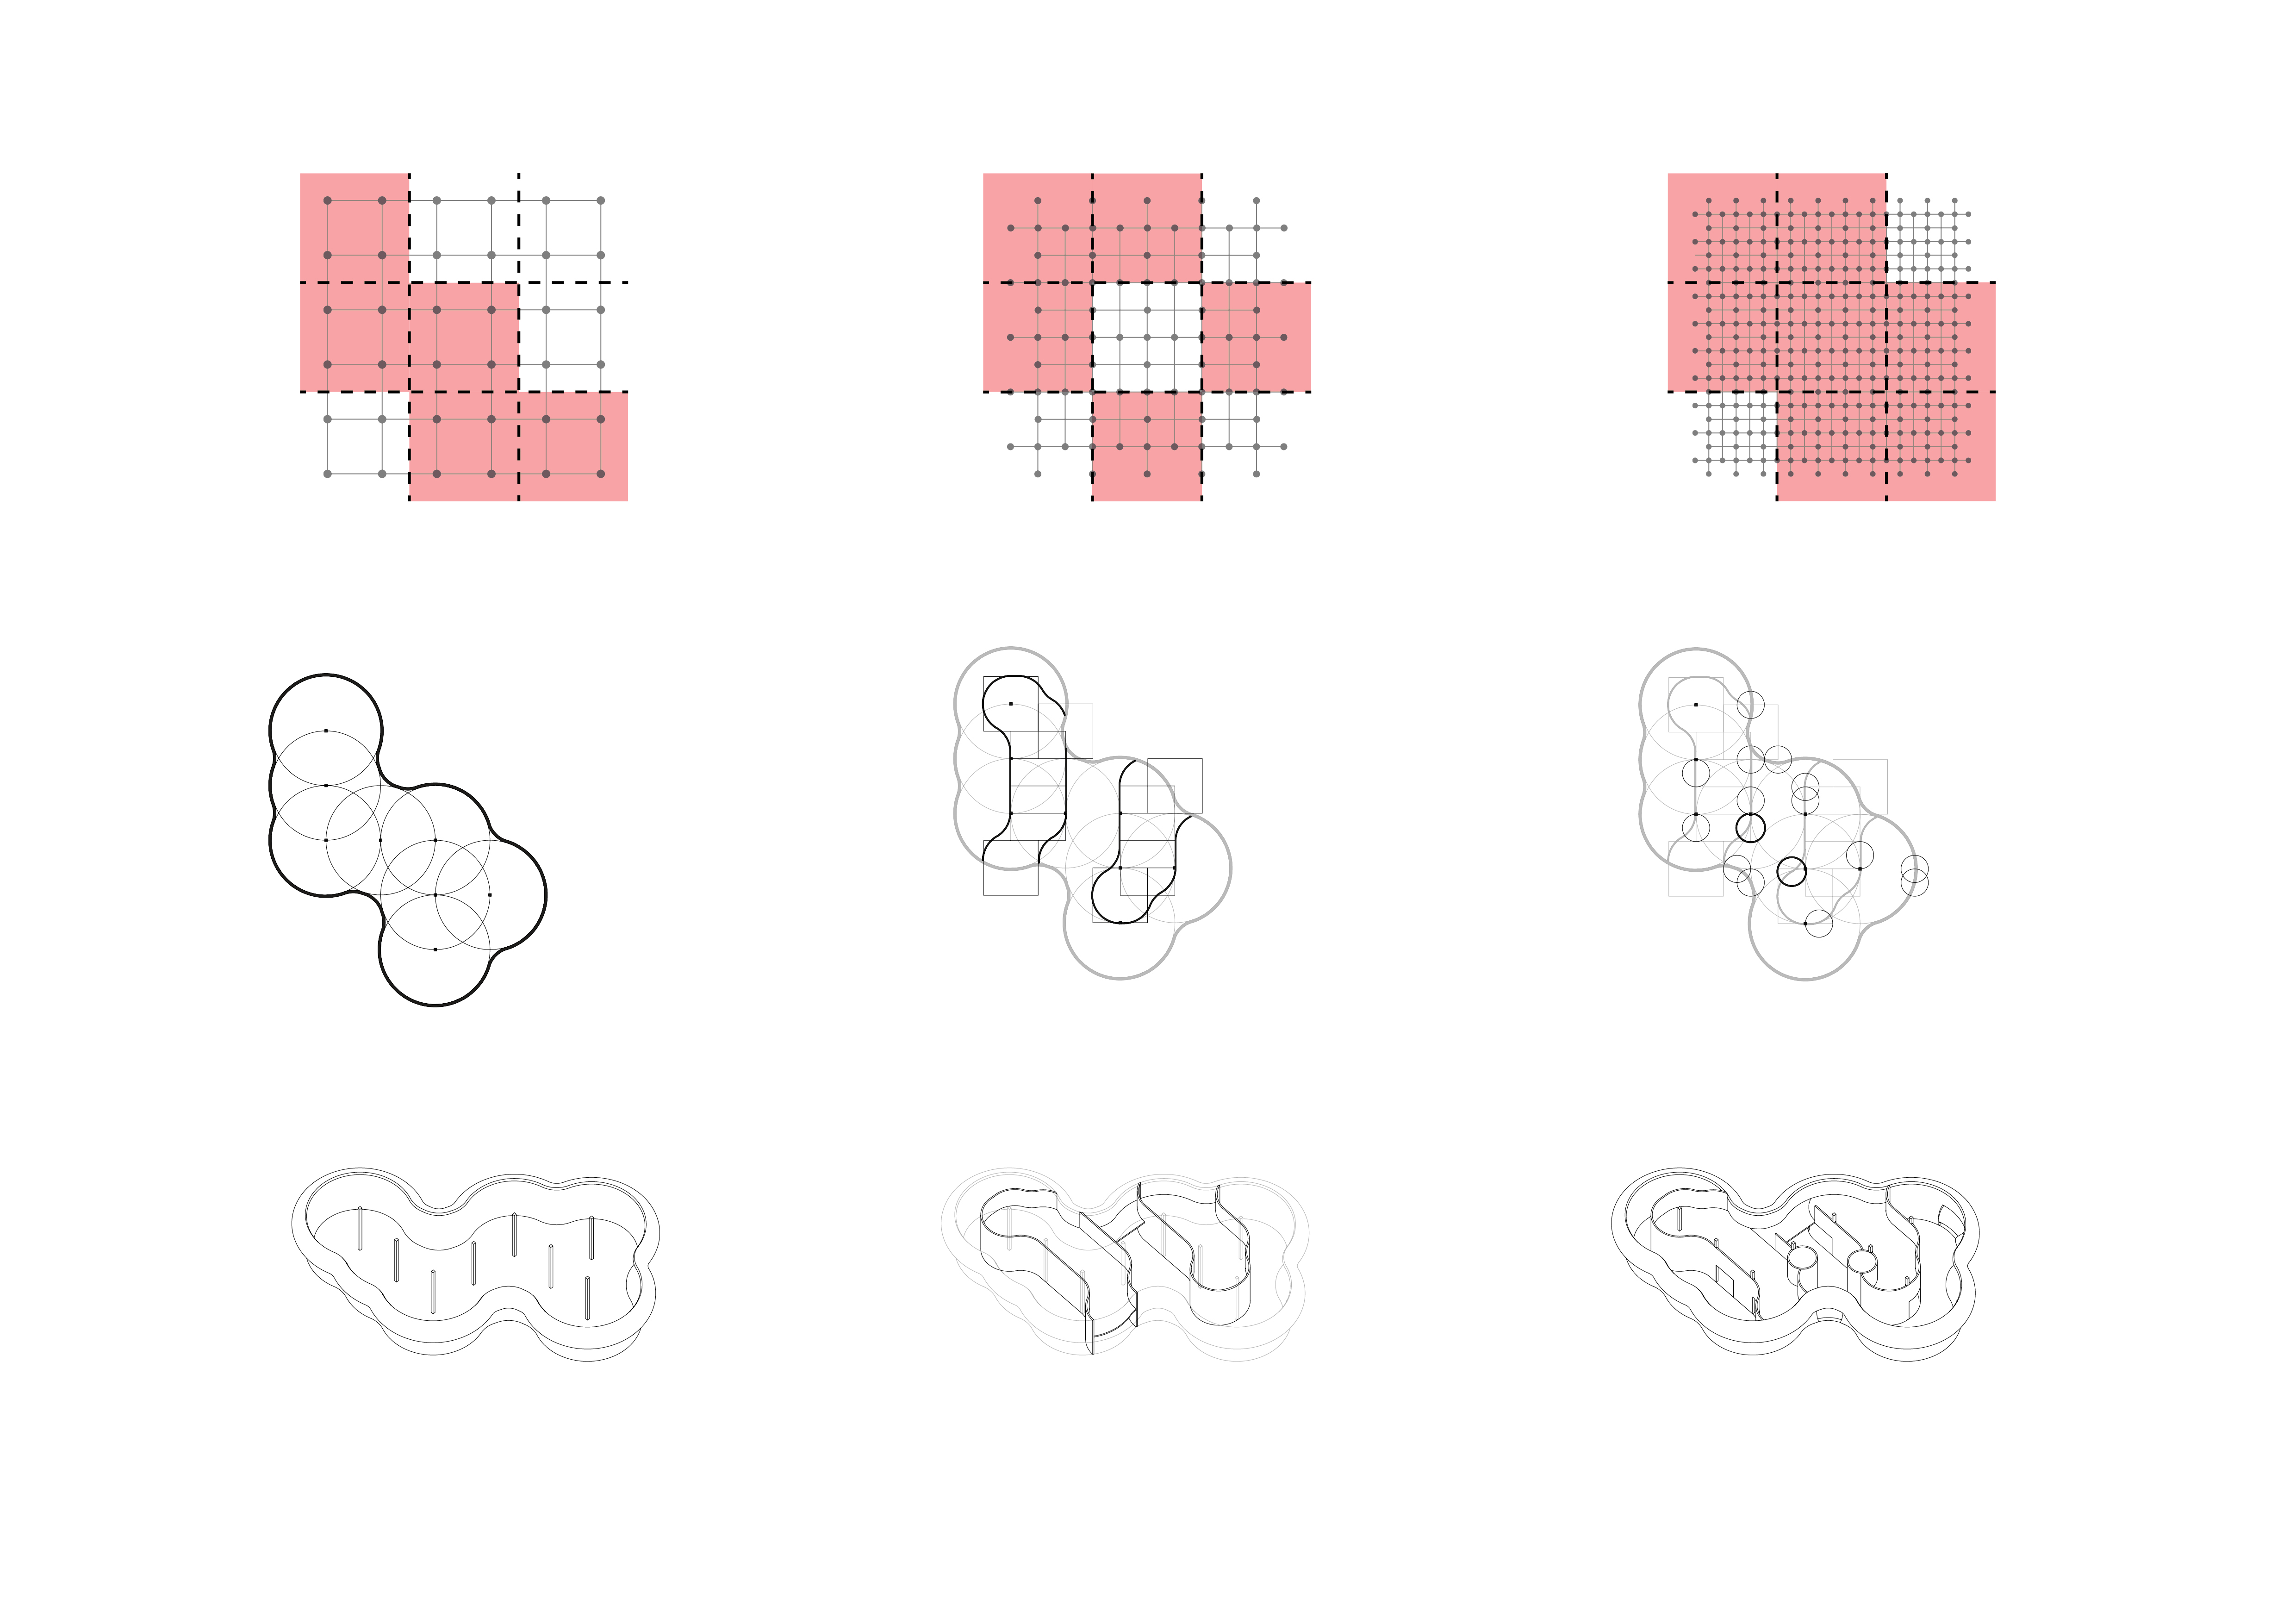
Previously I began to develop how my grid system would work in a 3-dimensional form. Offsetting the building boundary as it is extruded vertically, I experimented with different curve patterns to see how the external form could be generated.

A

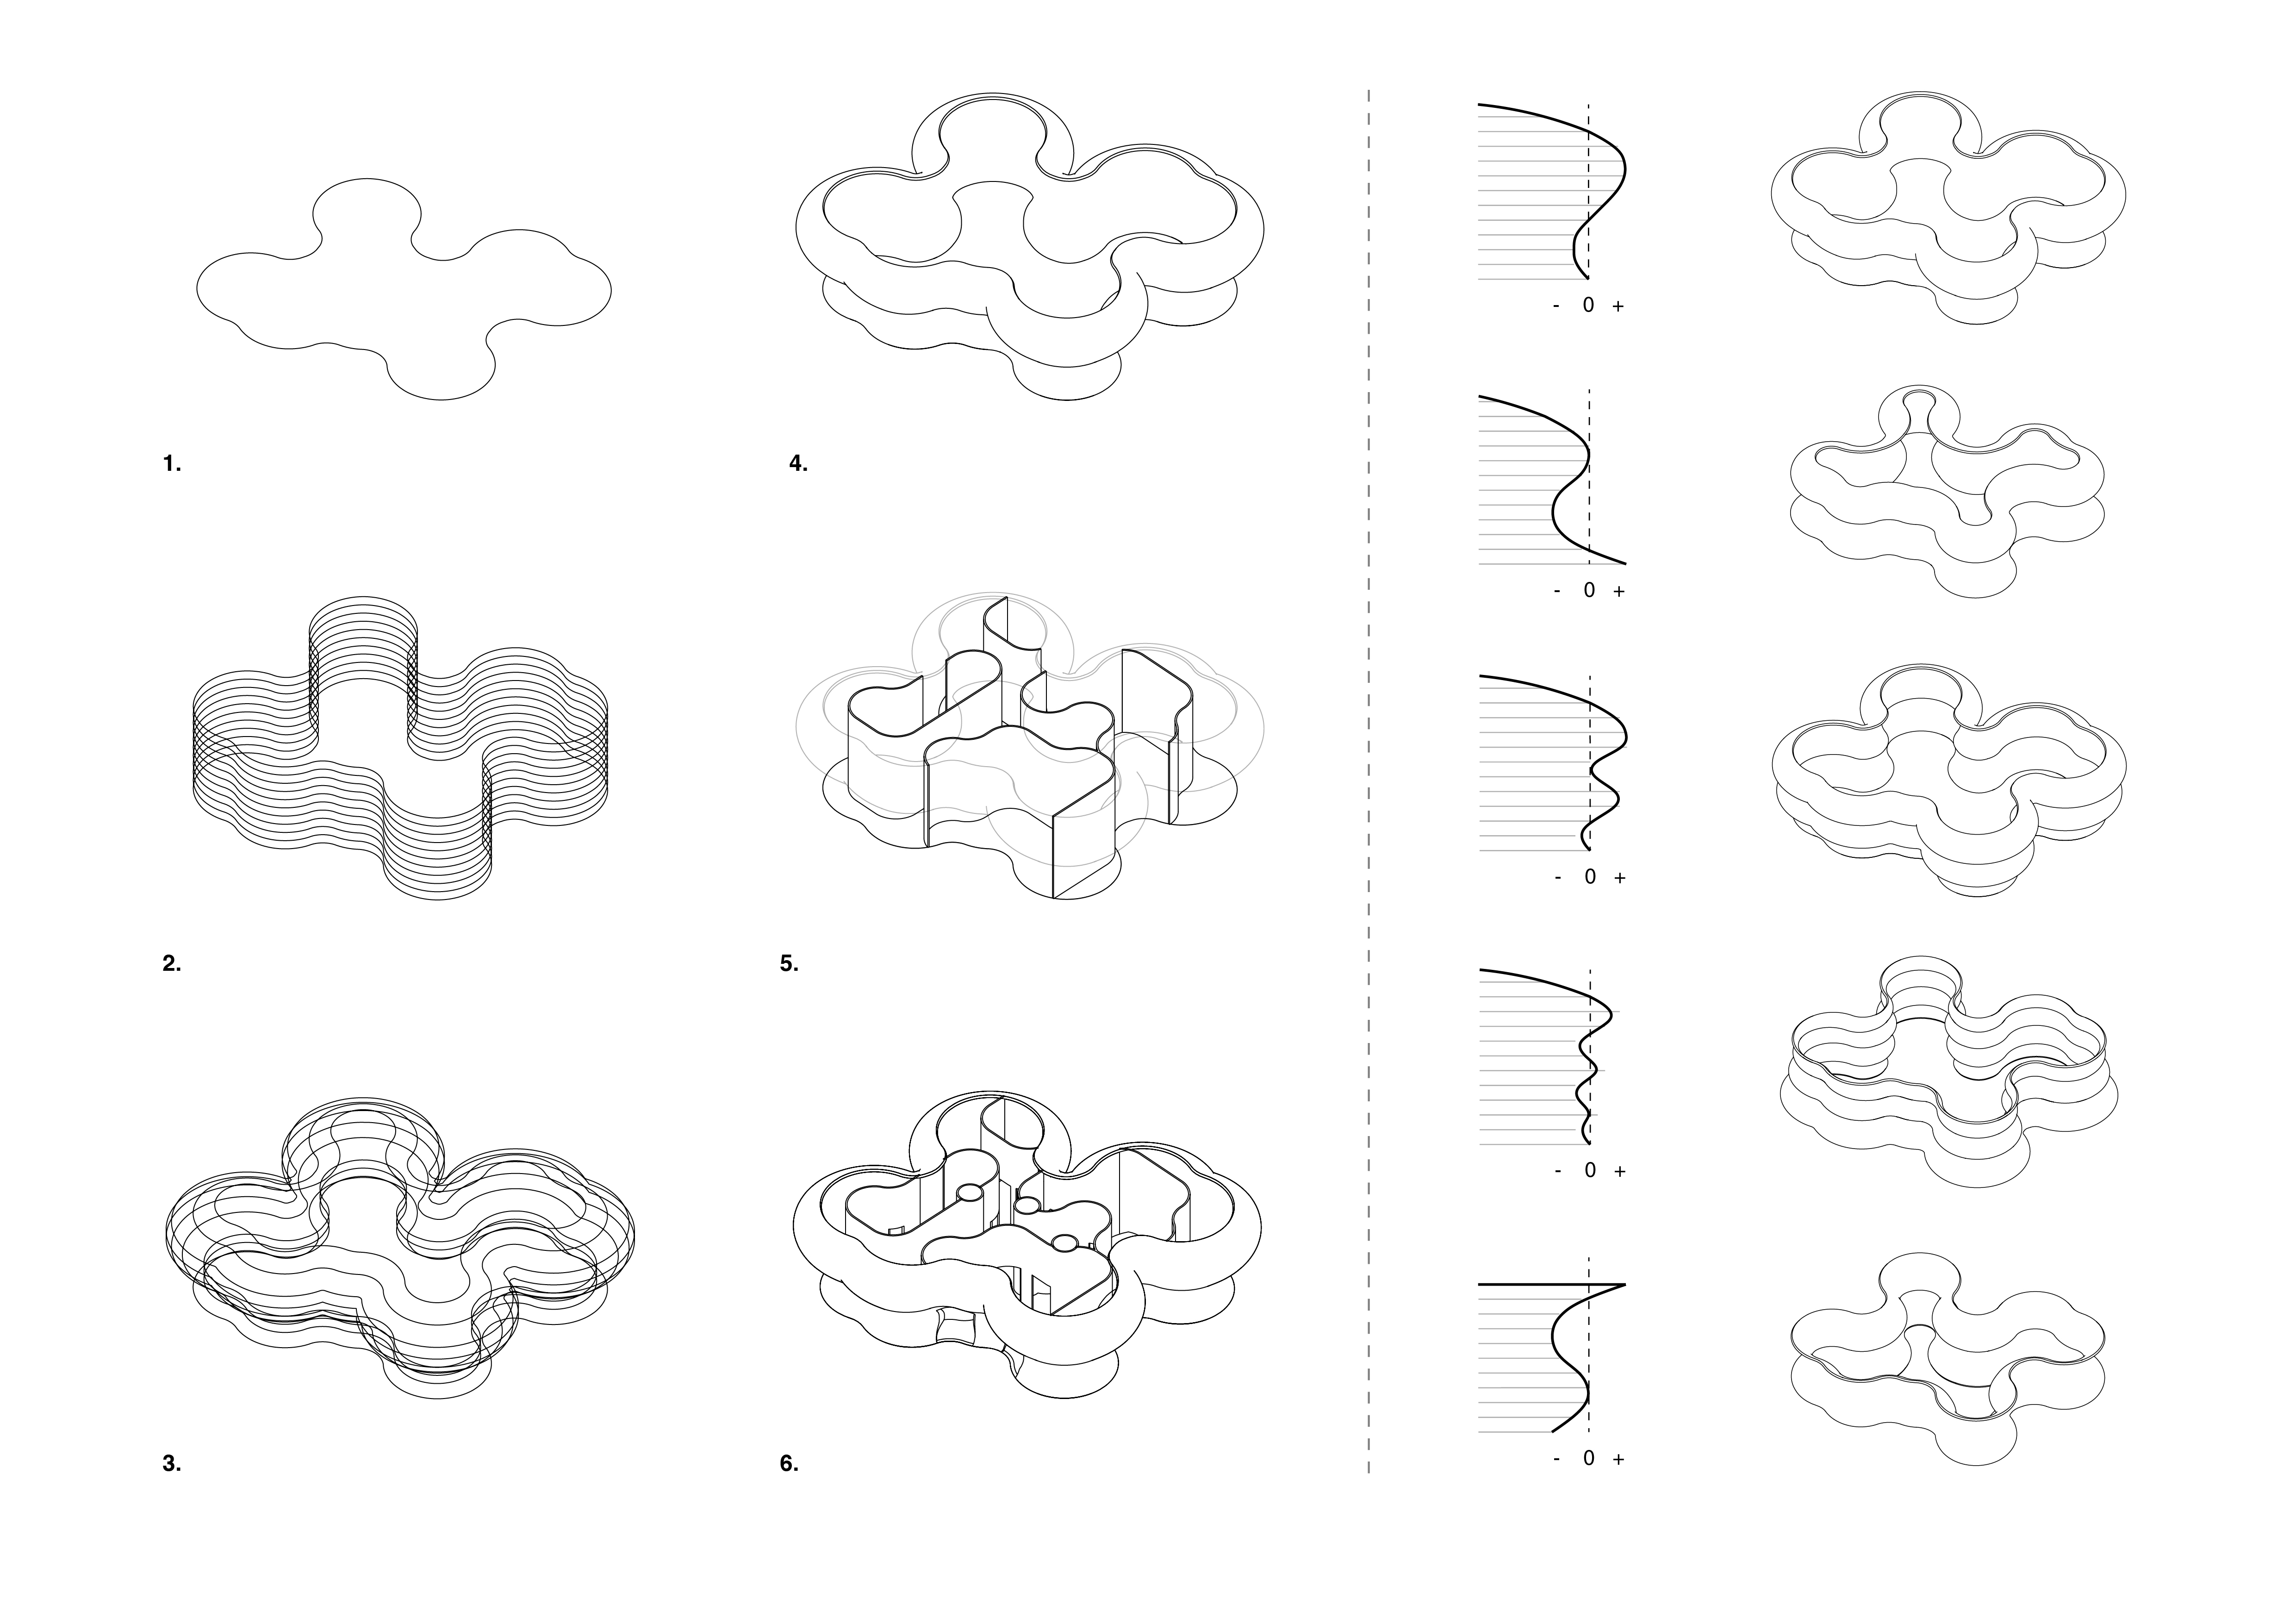
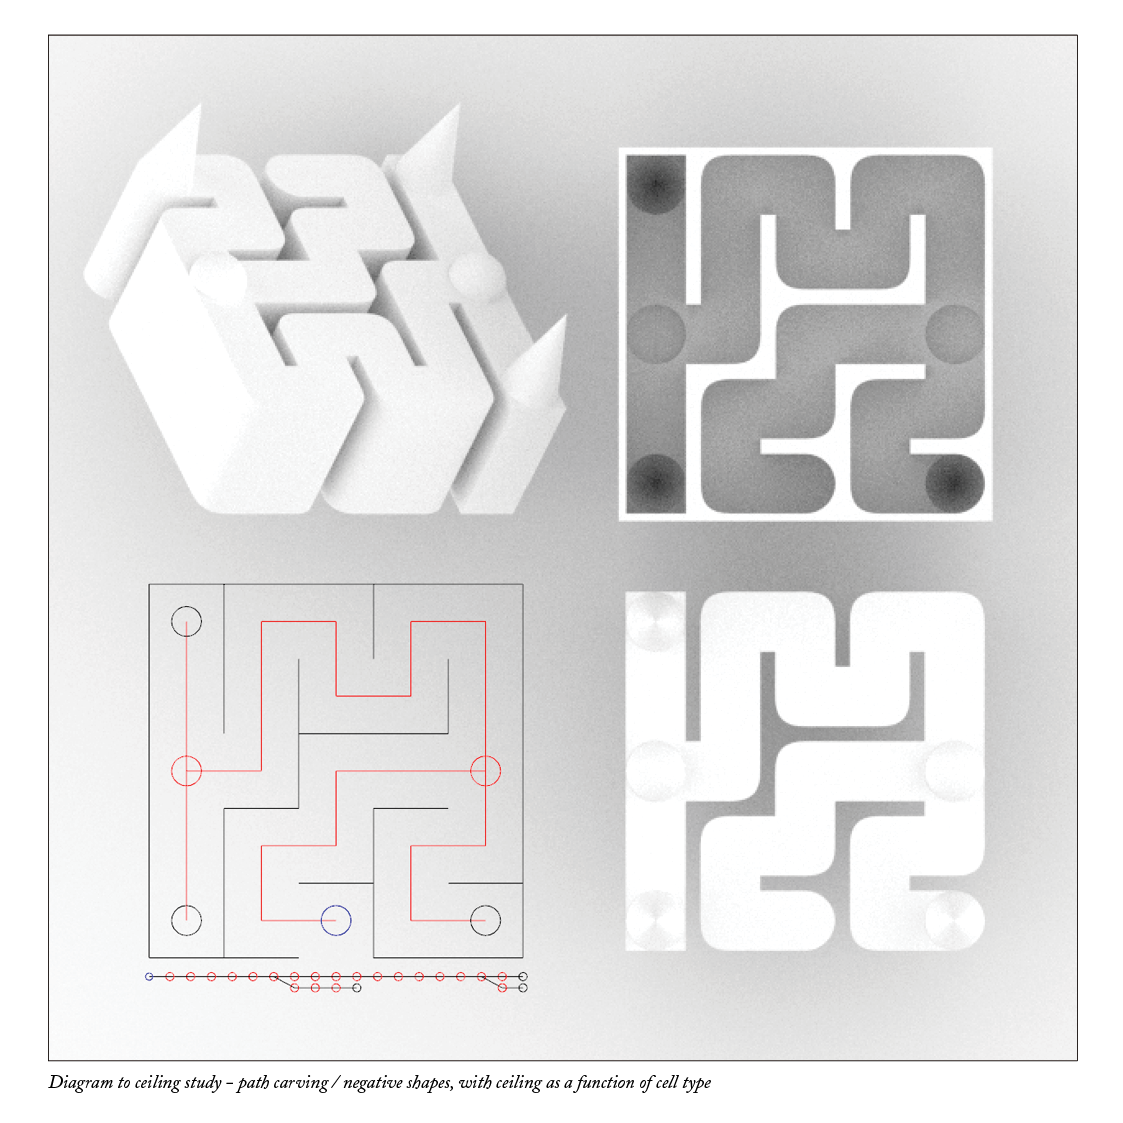
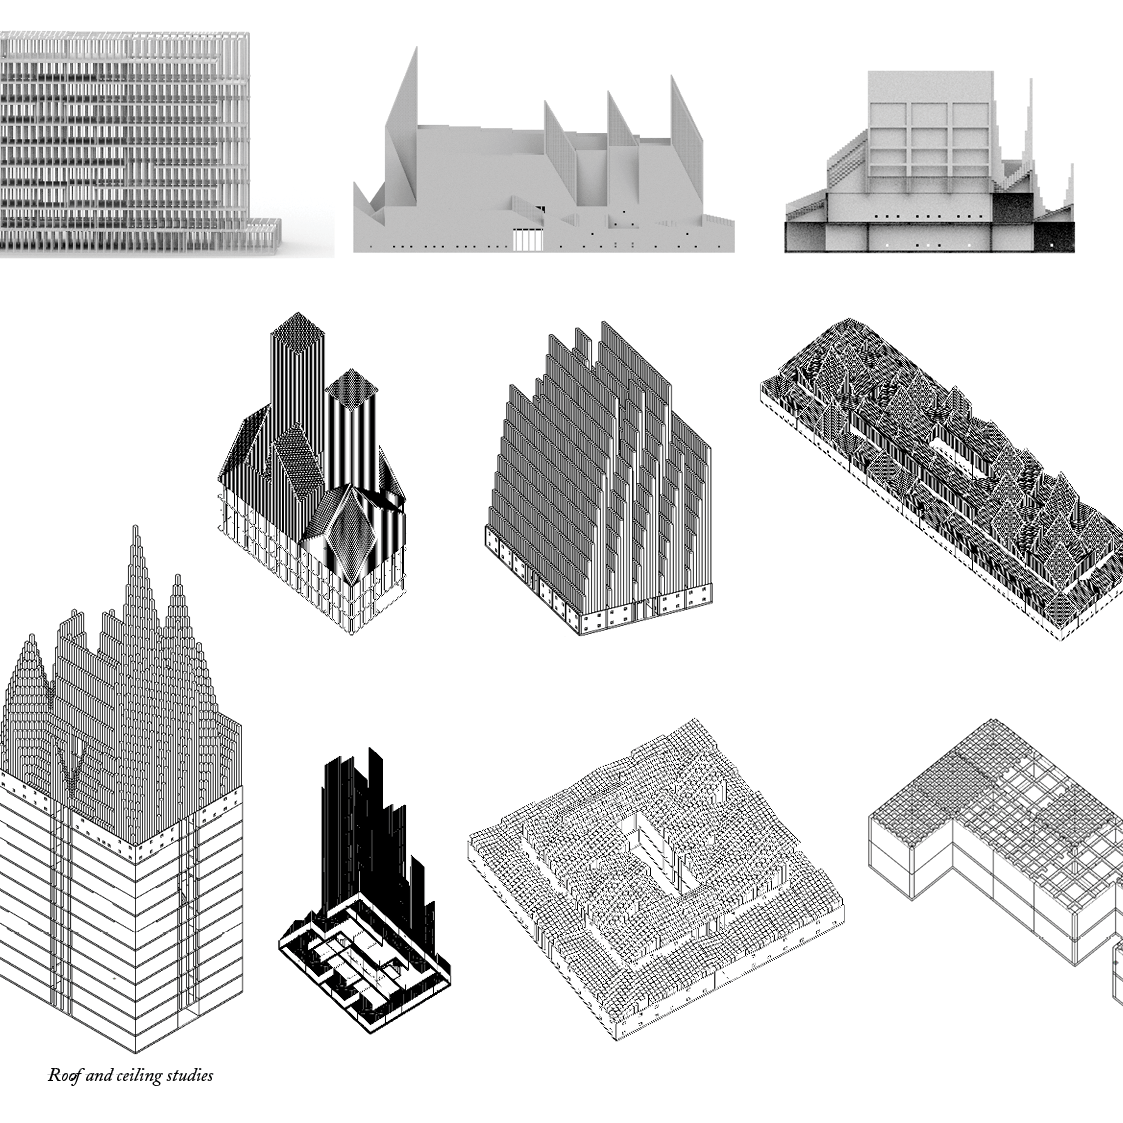
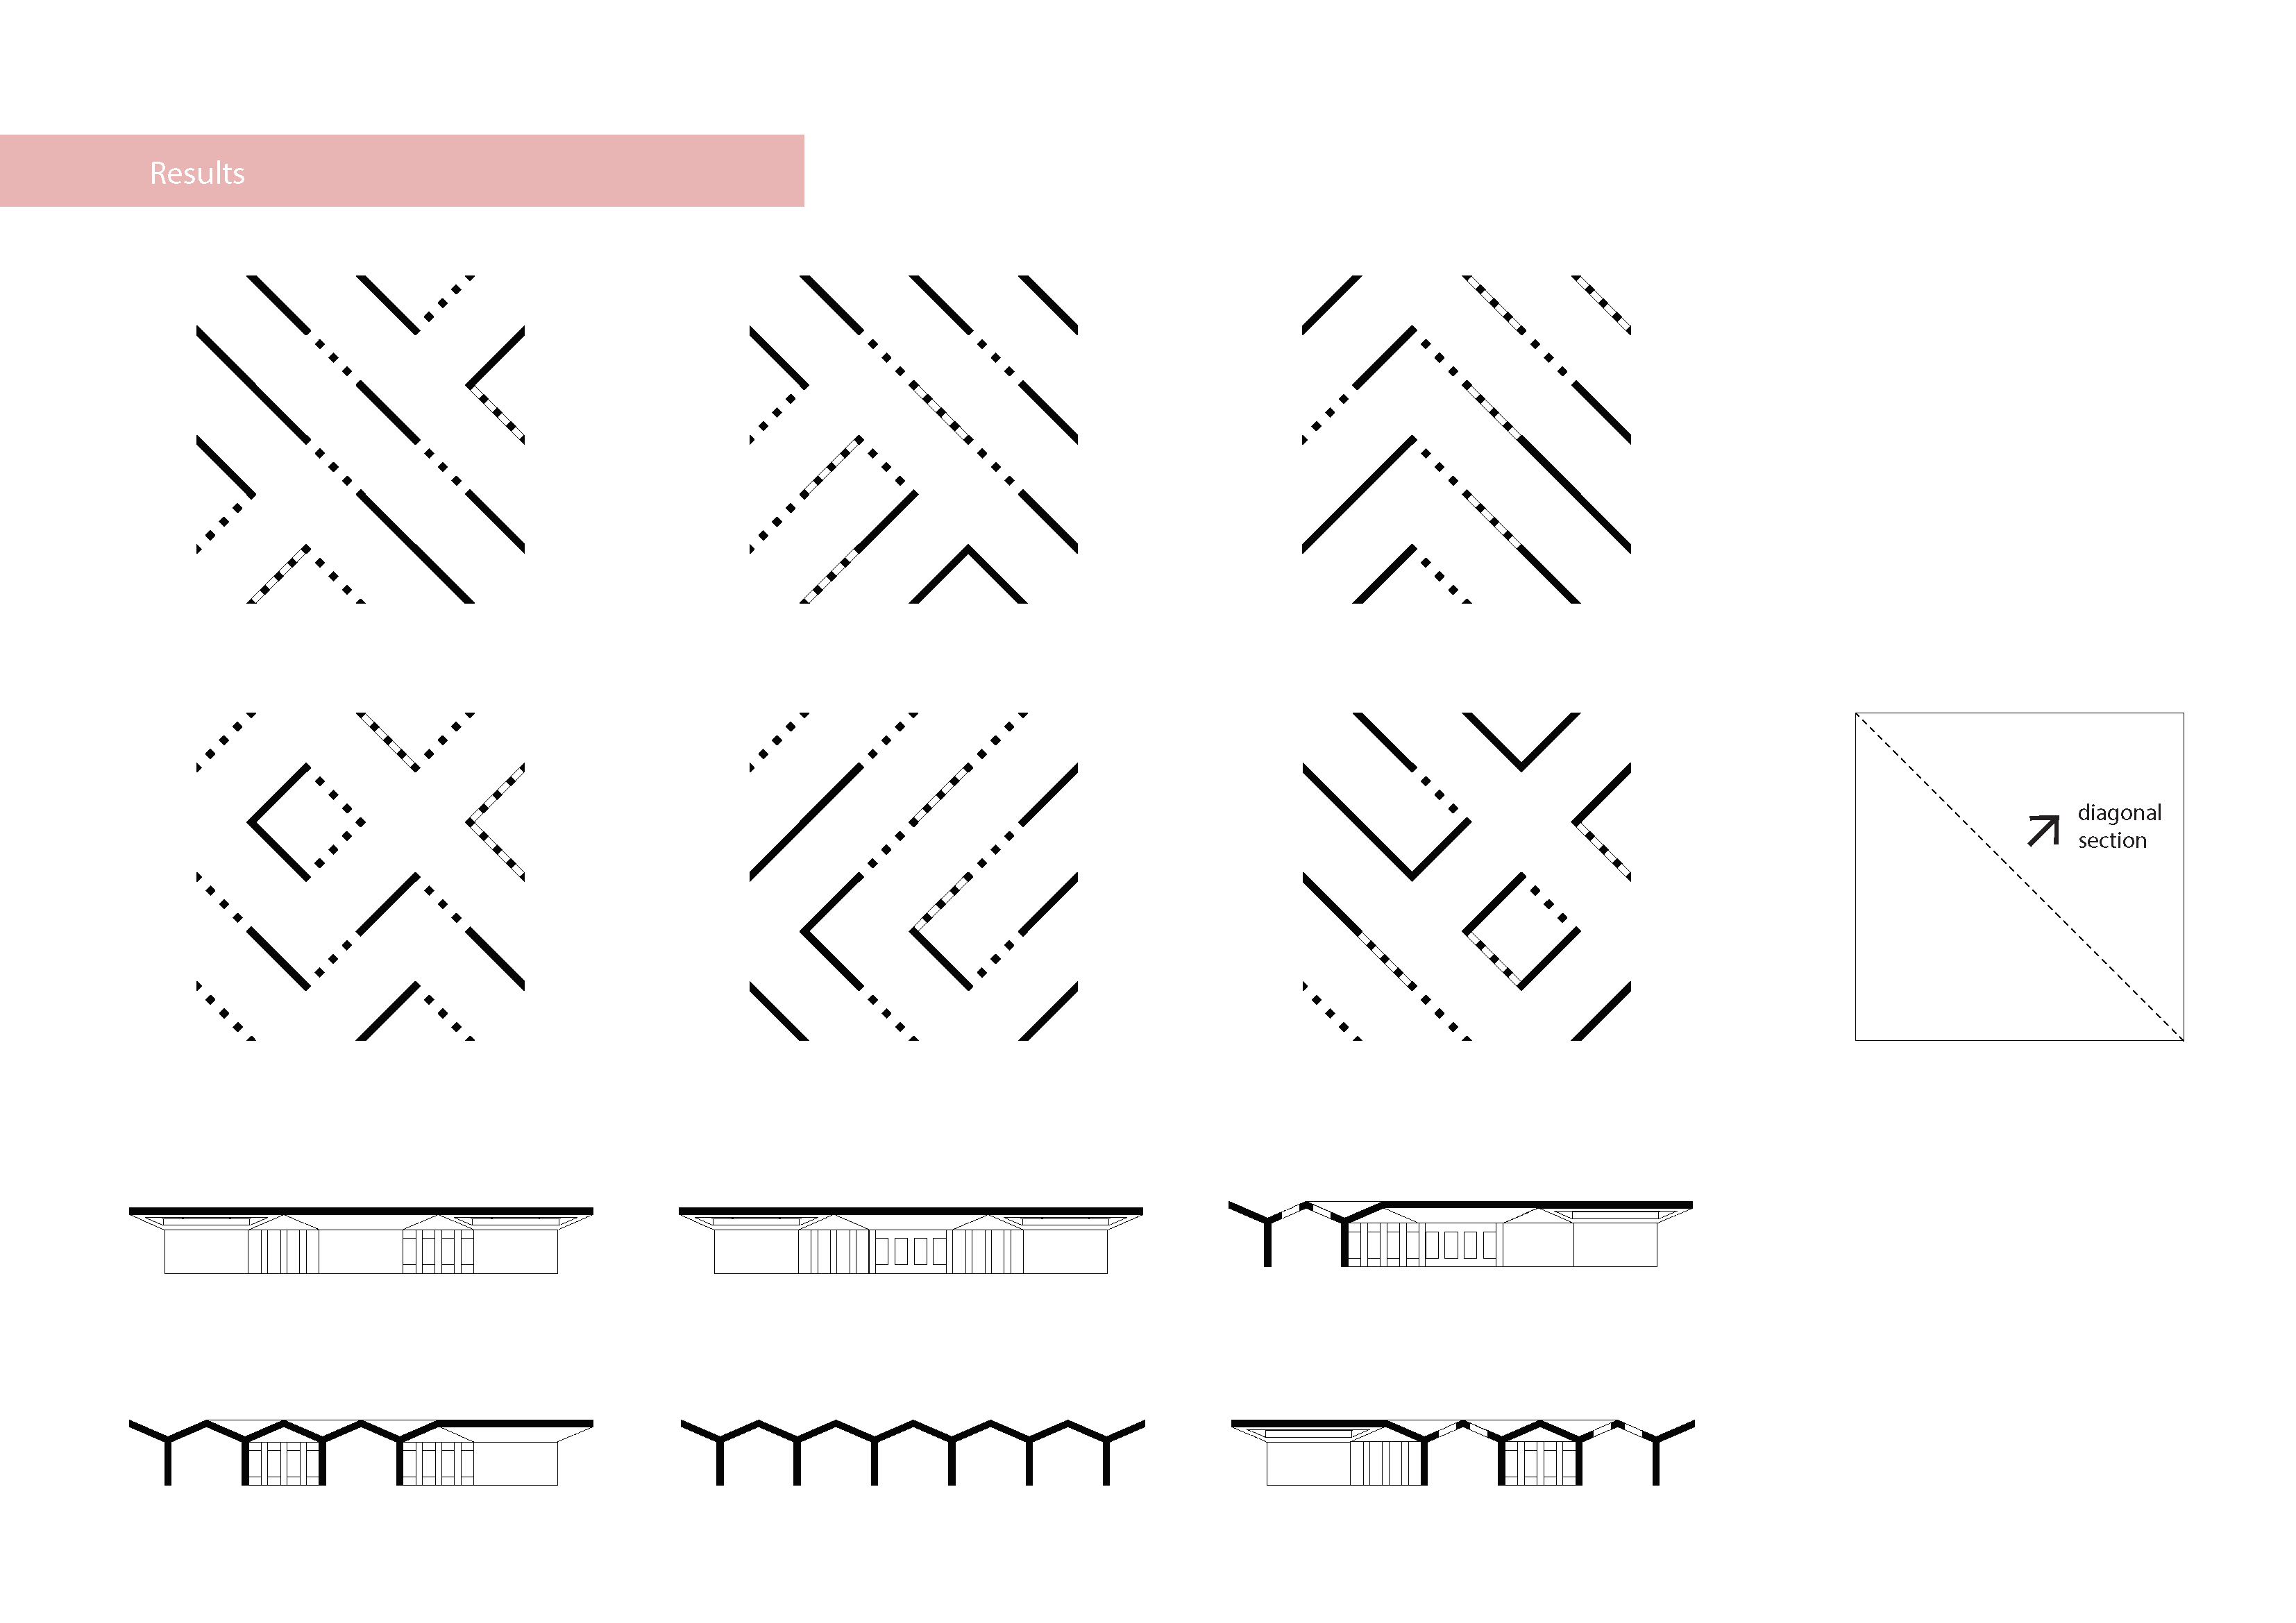
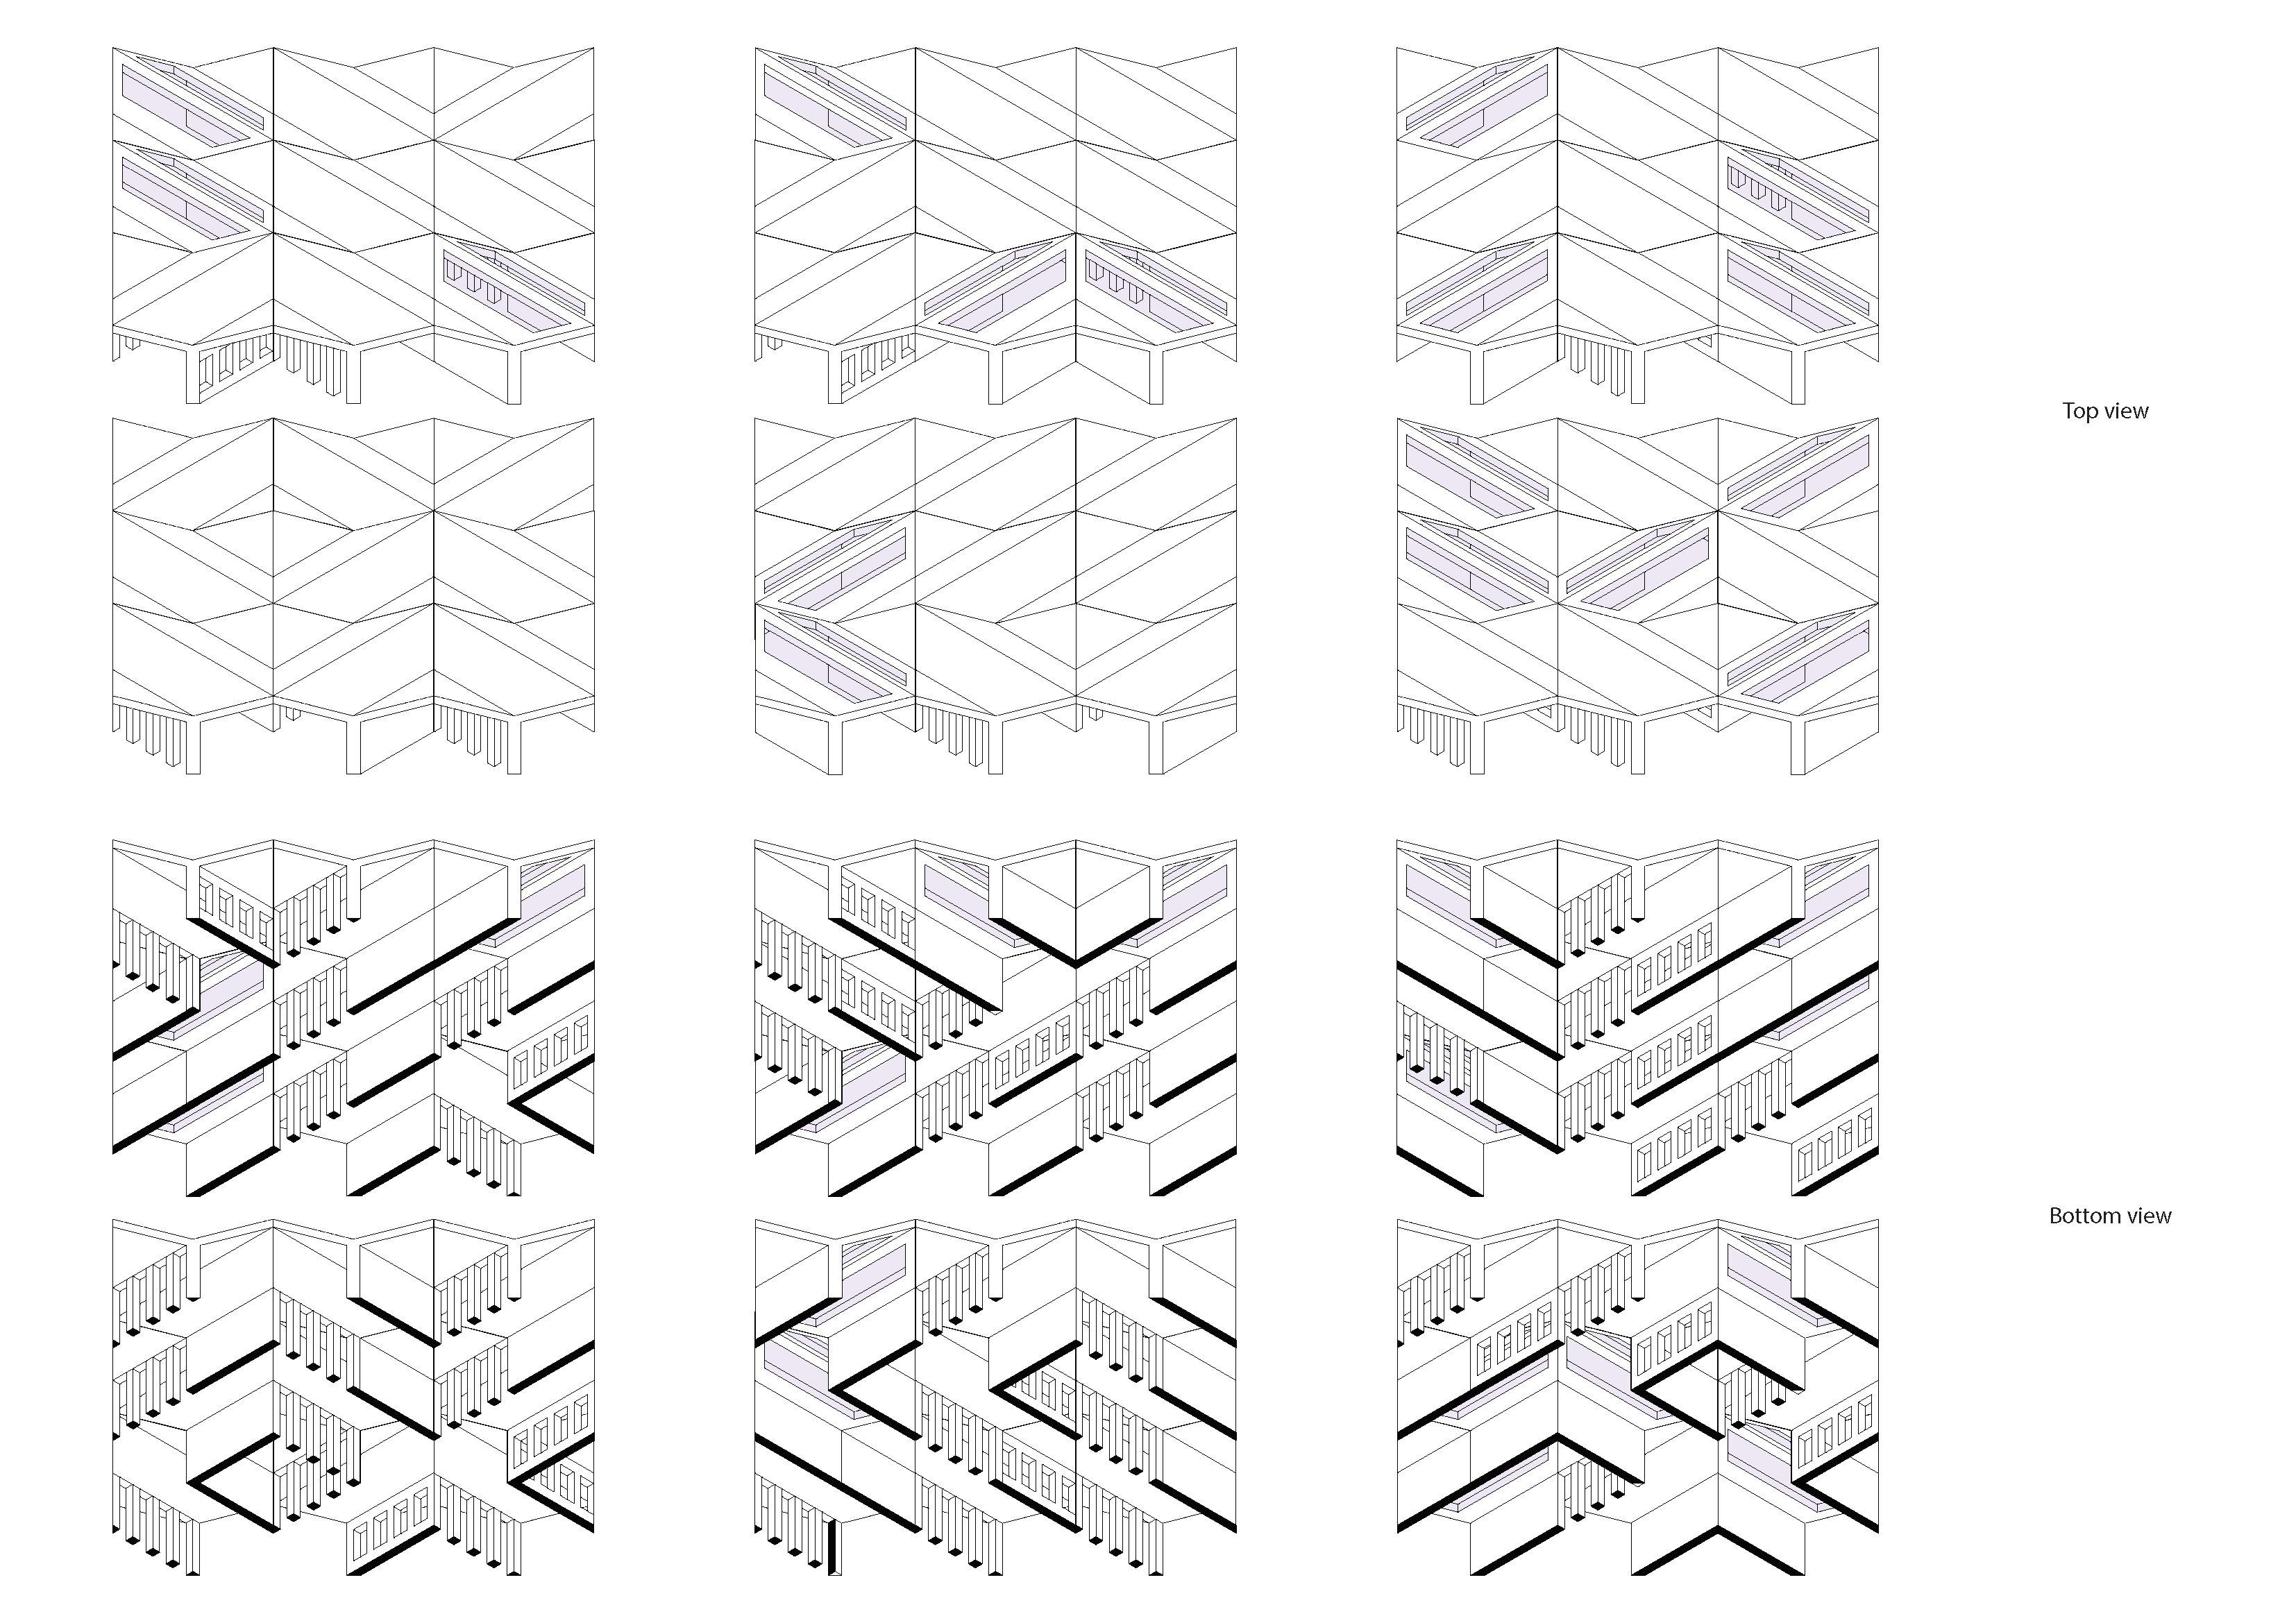
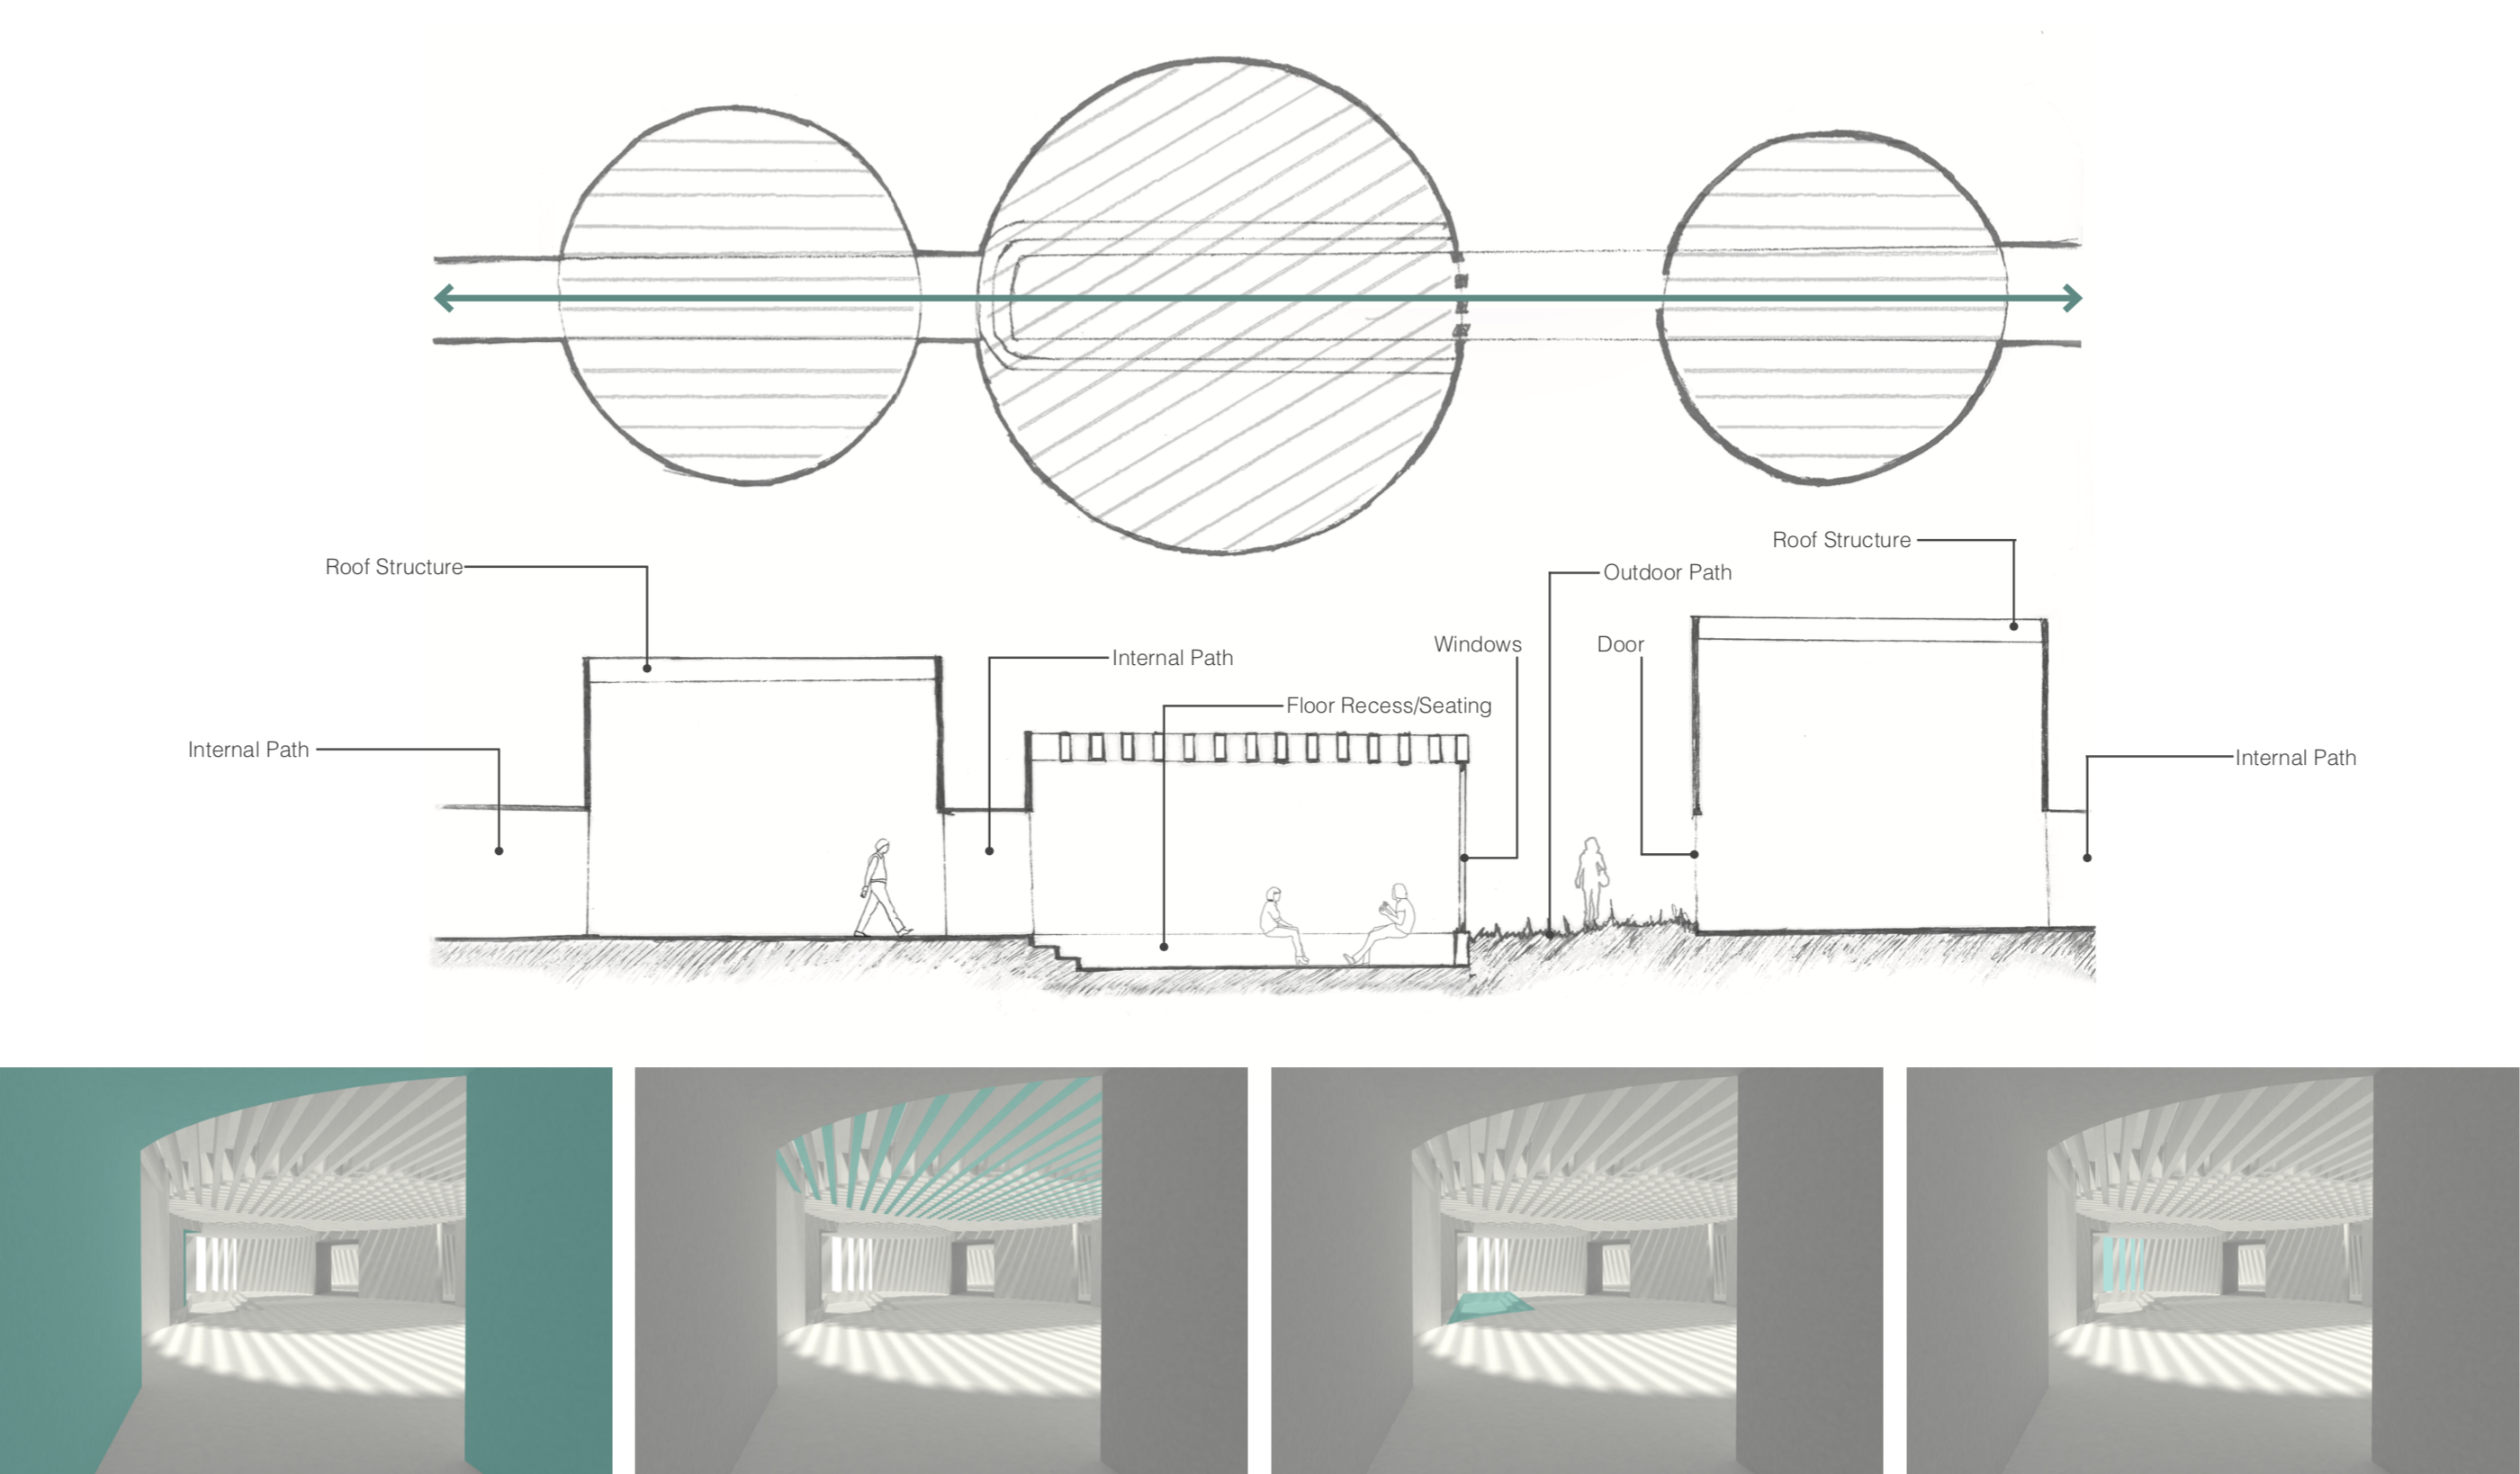
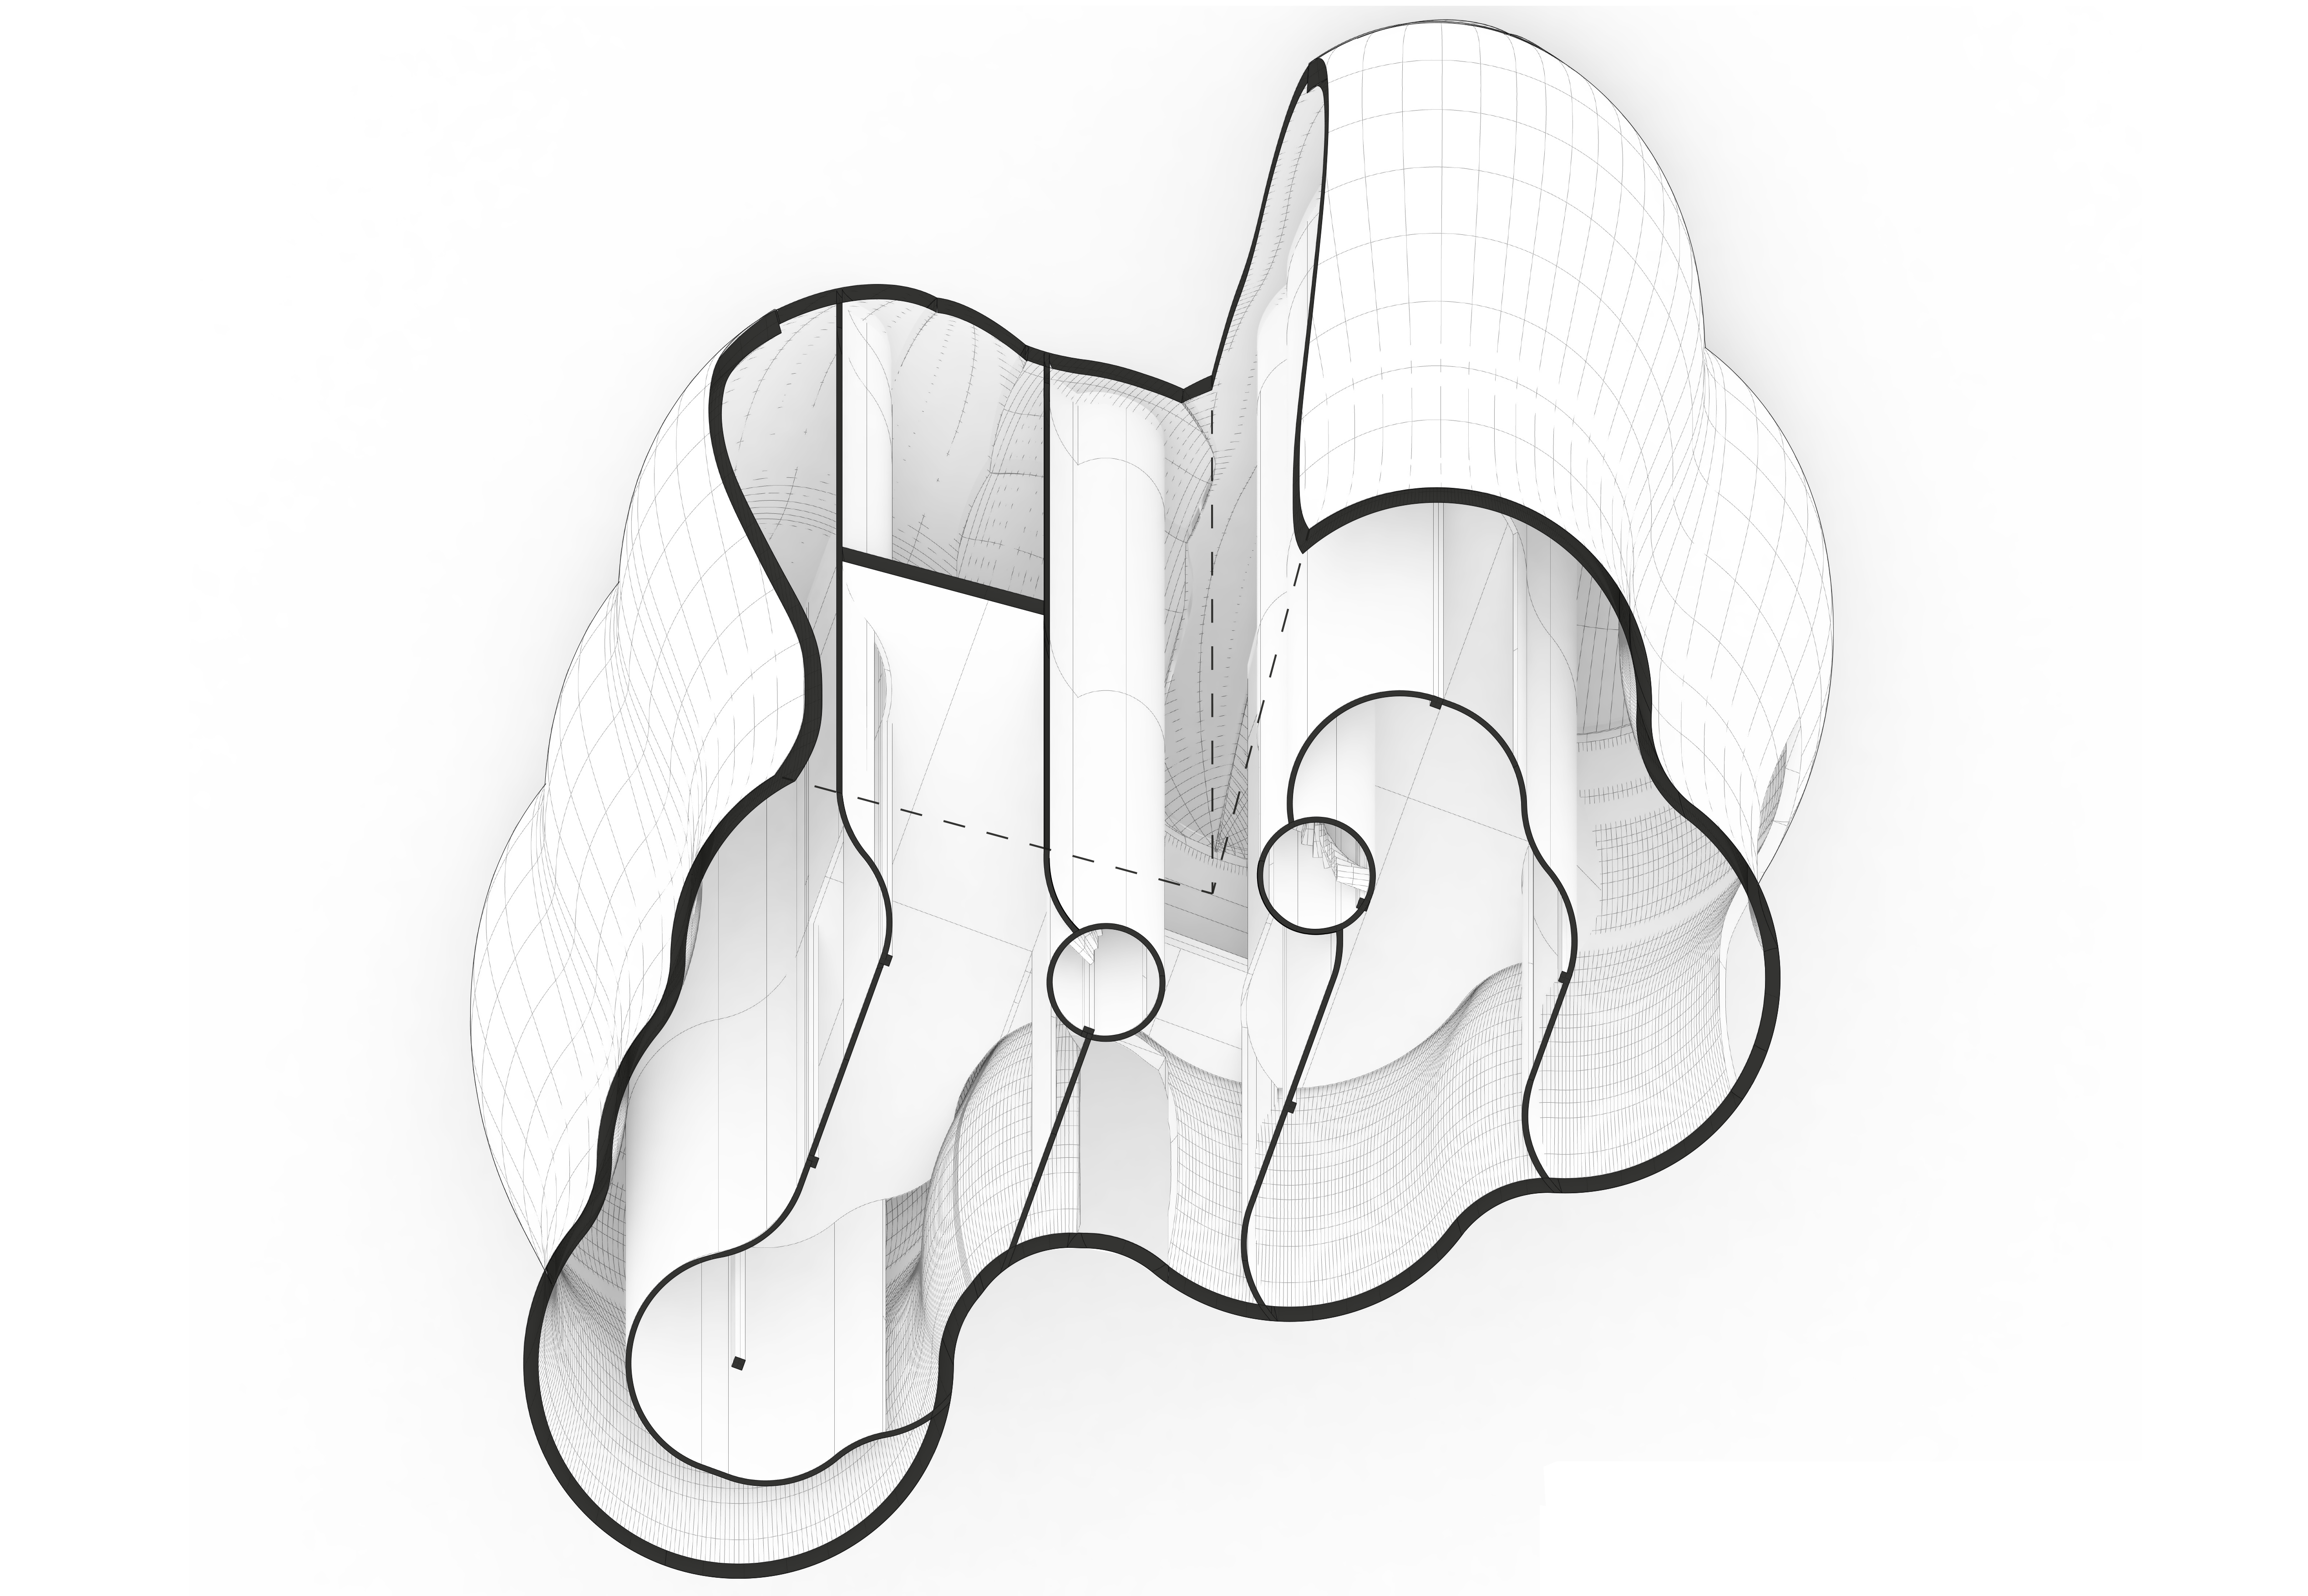
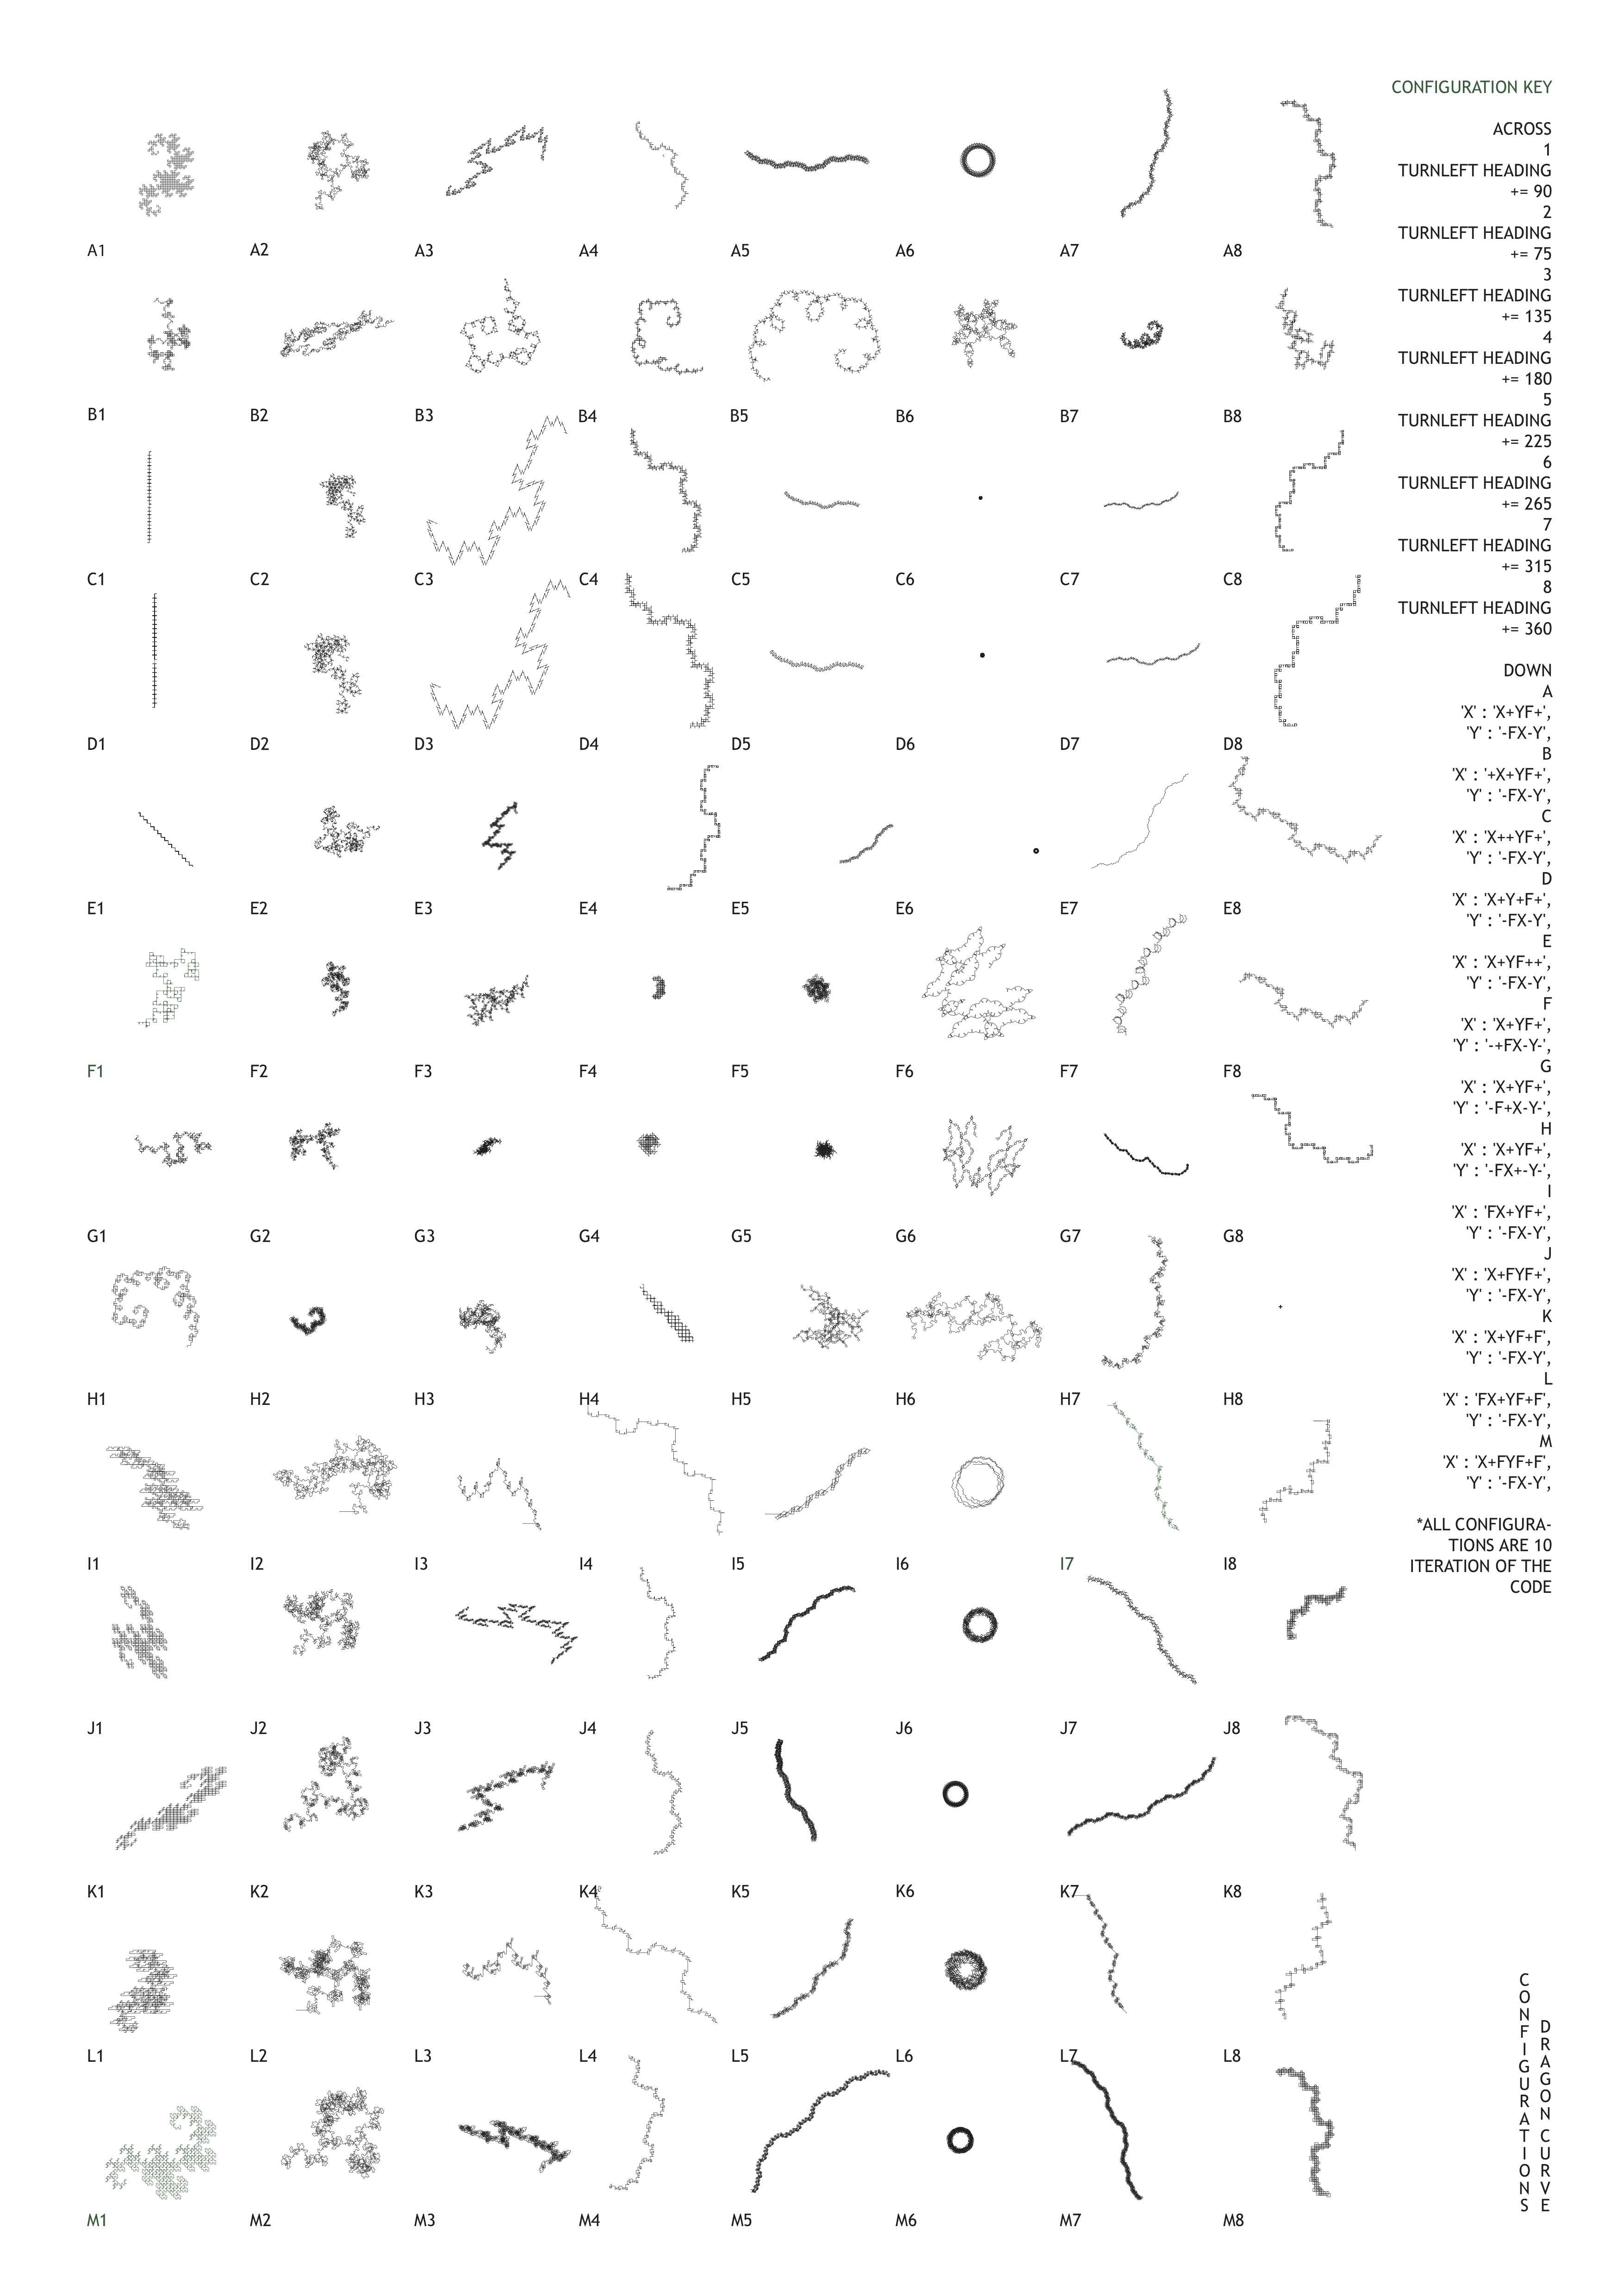
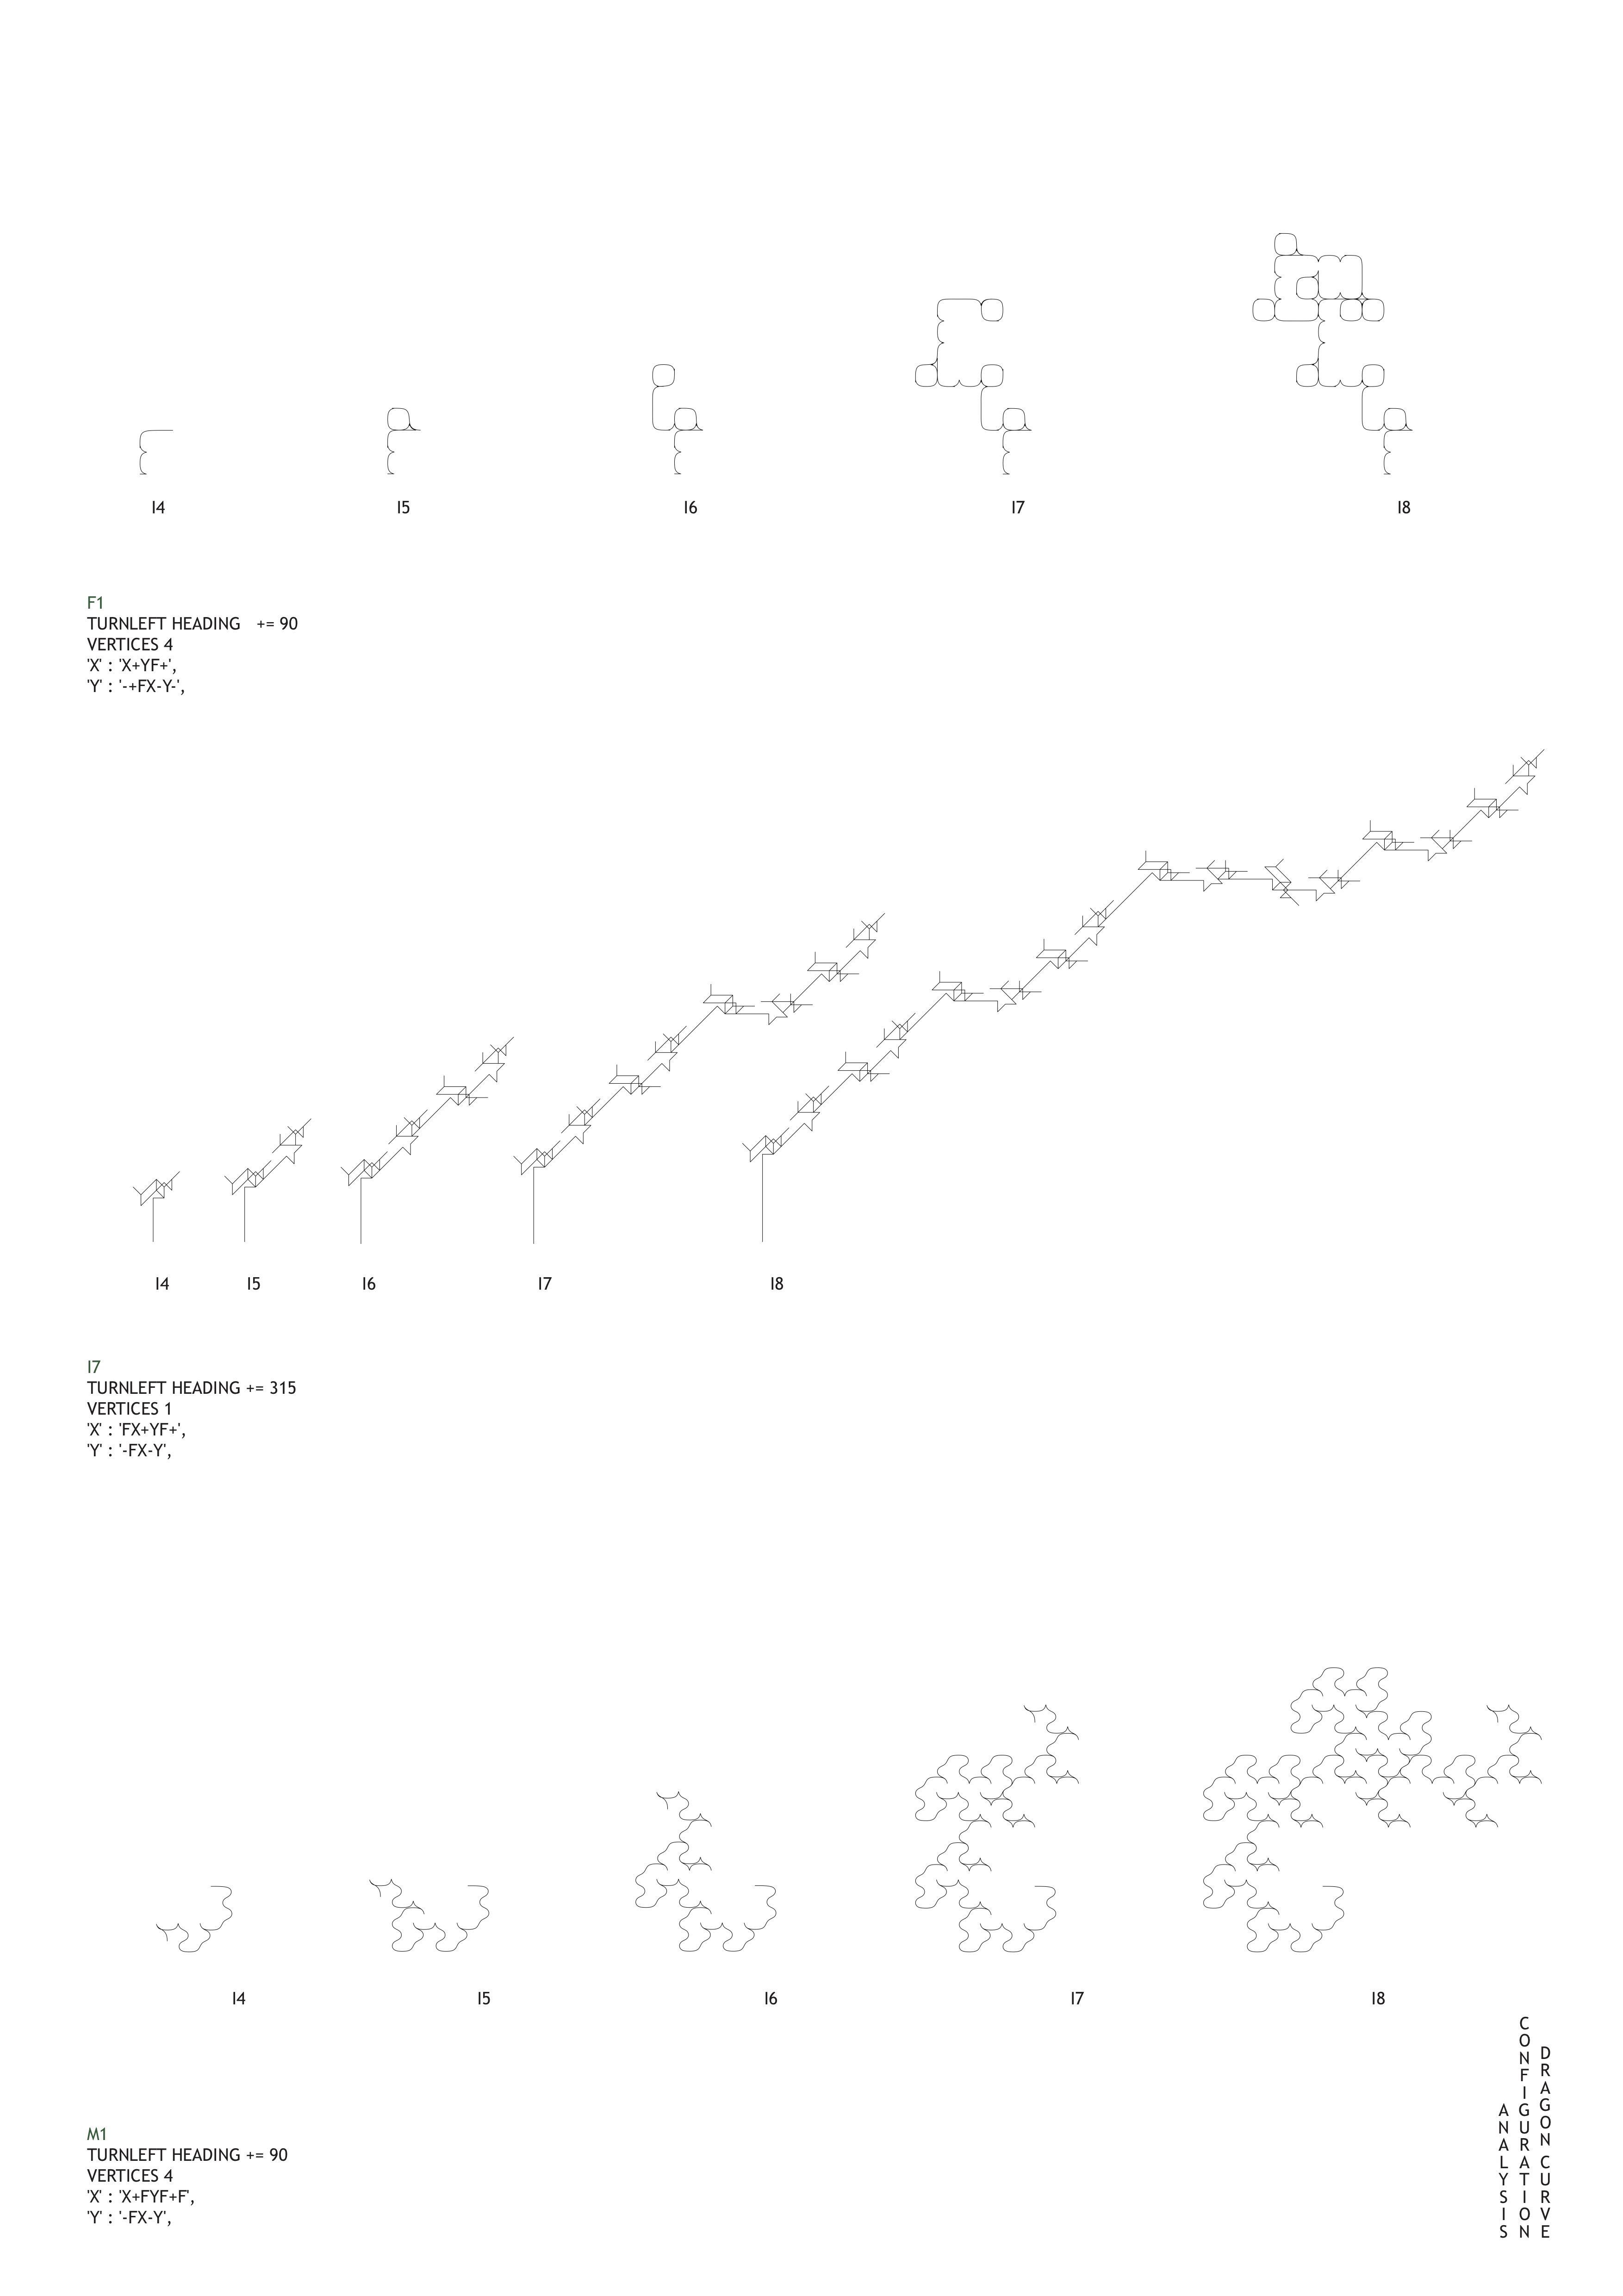
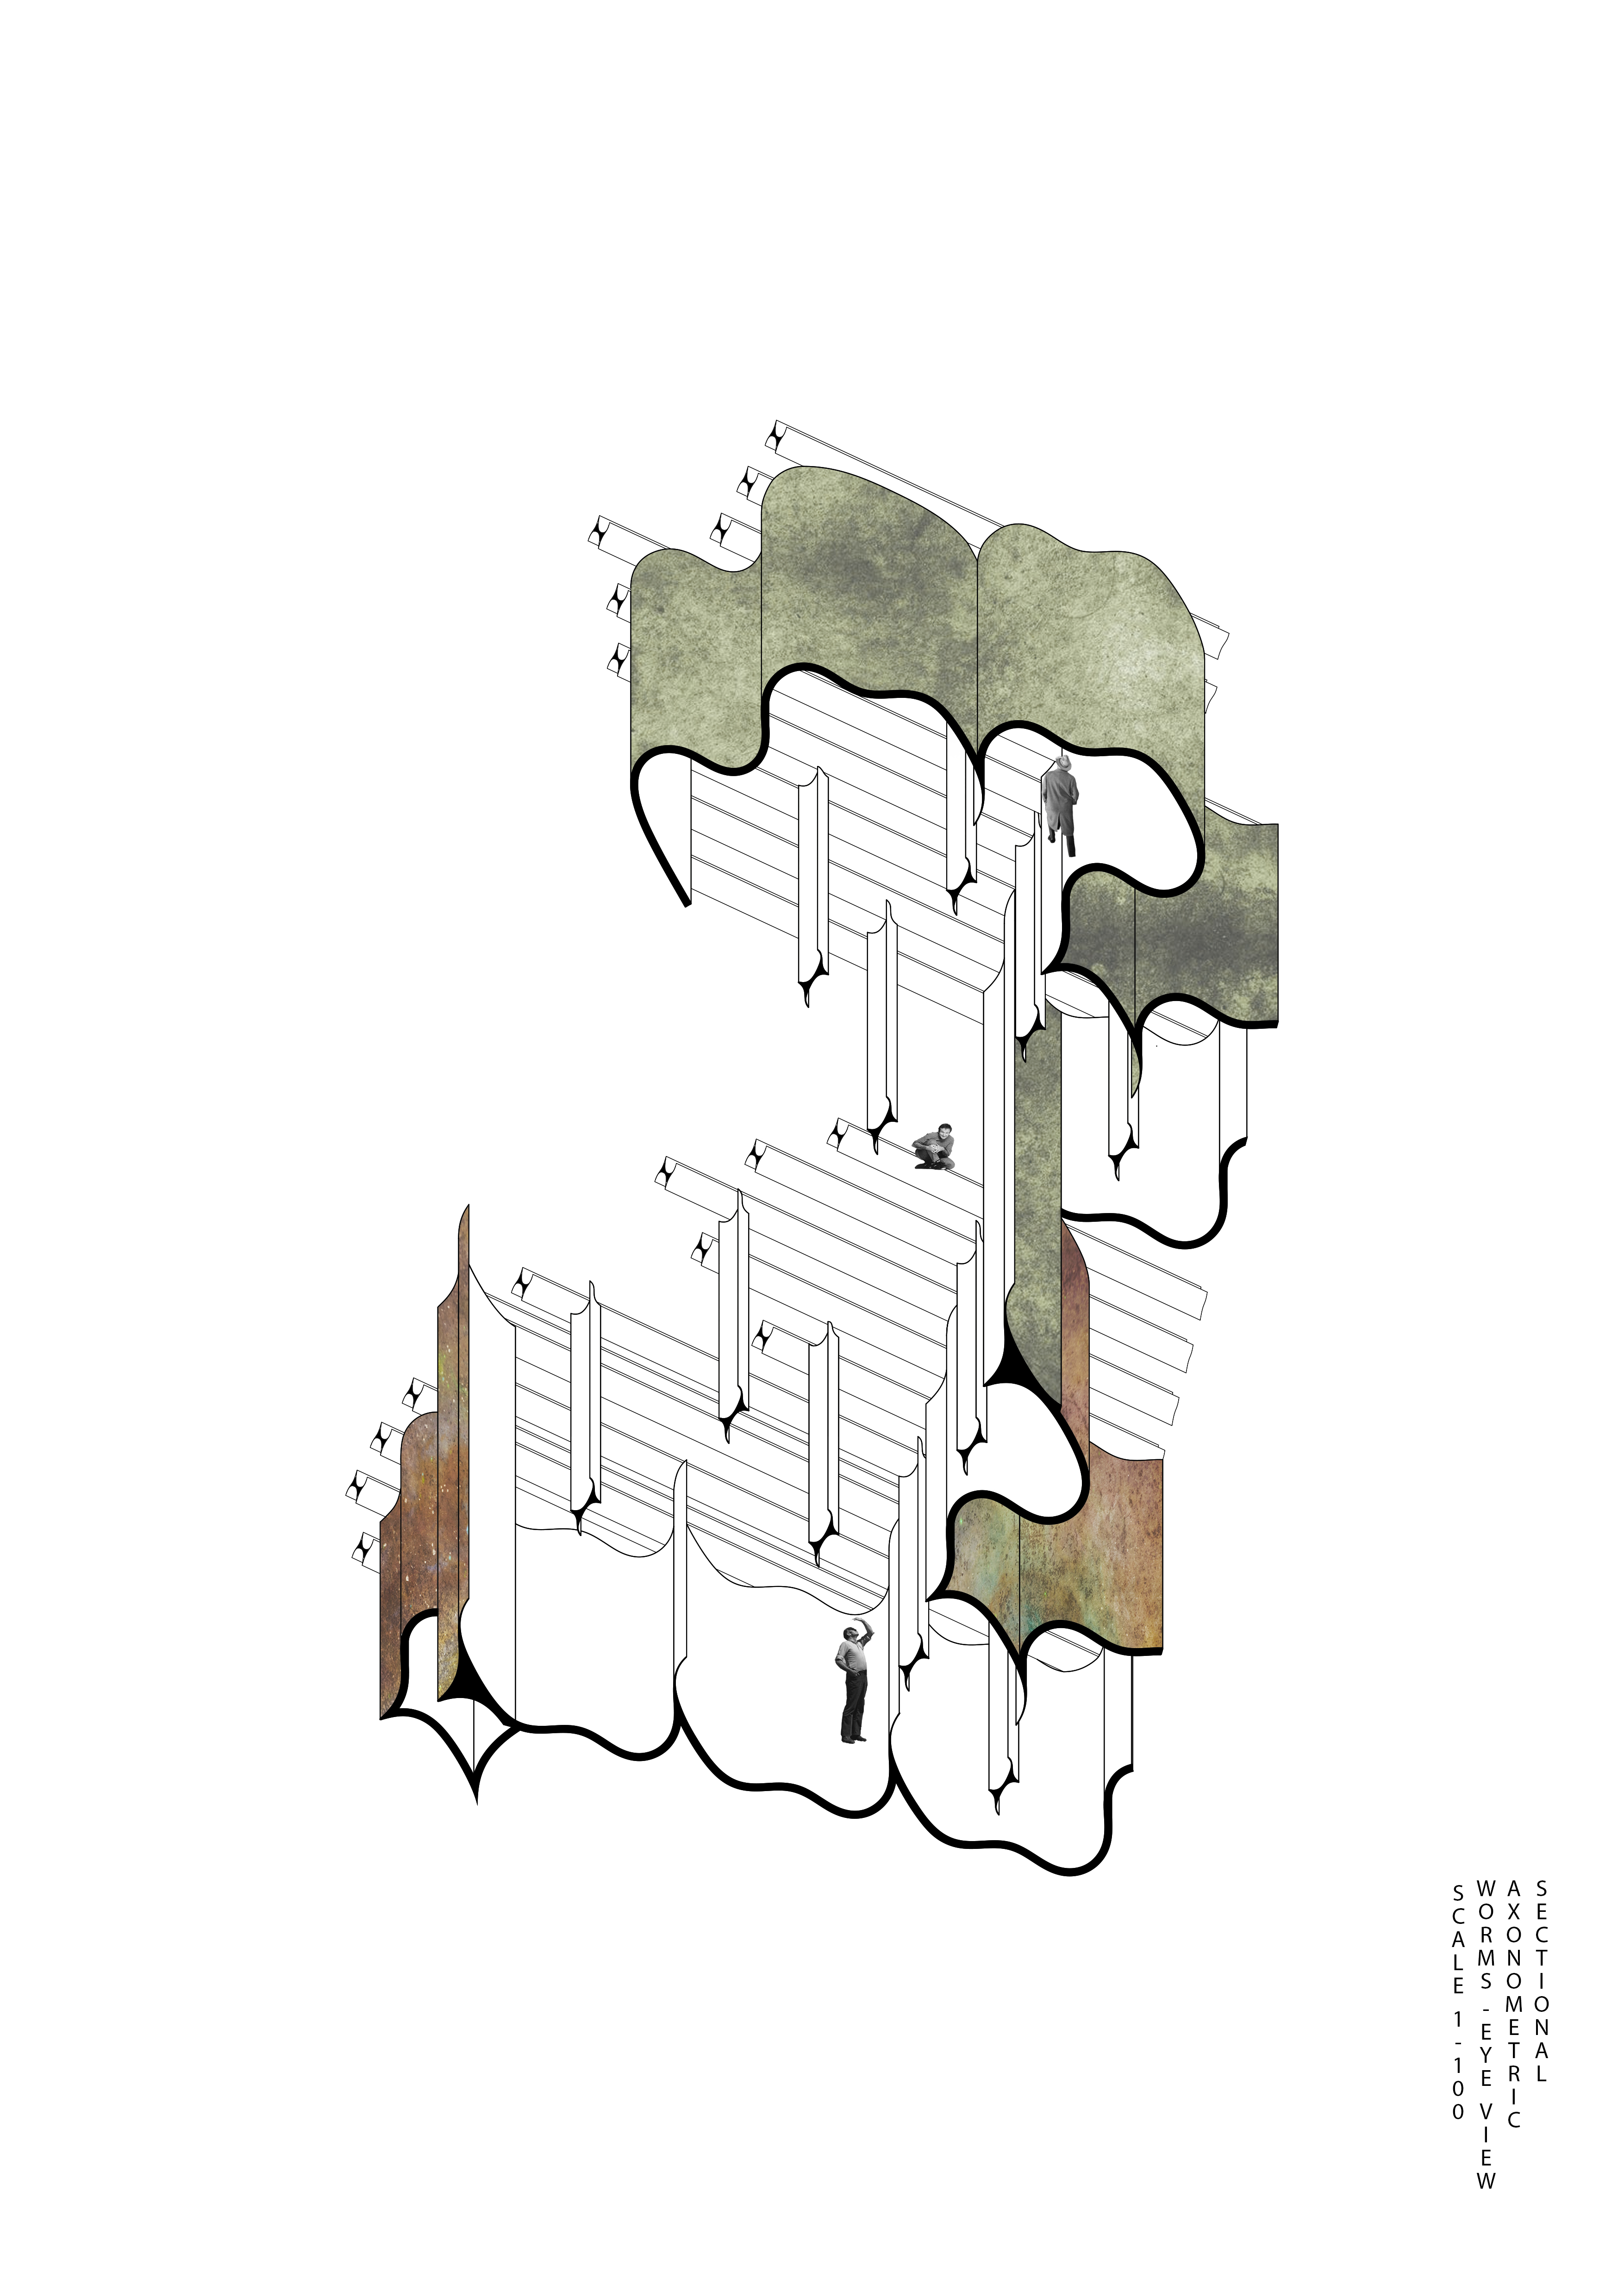
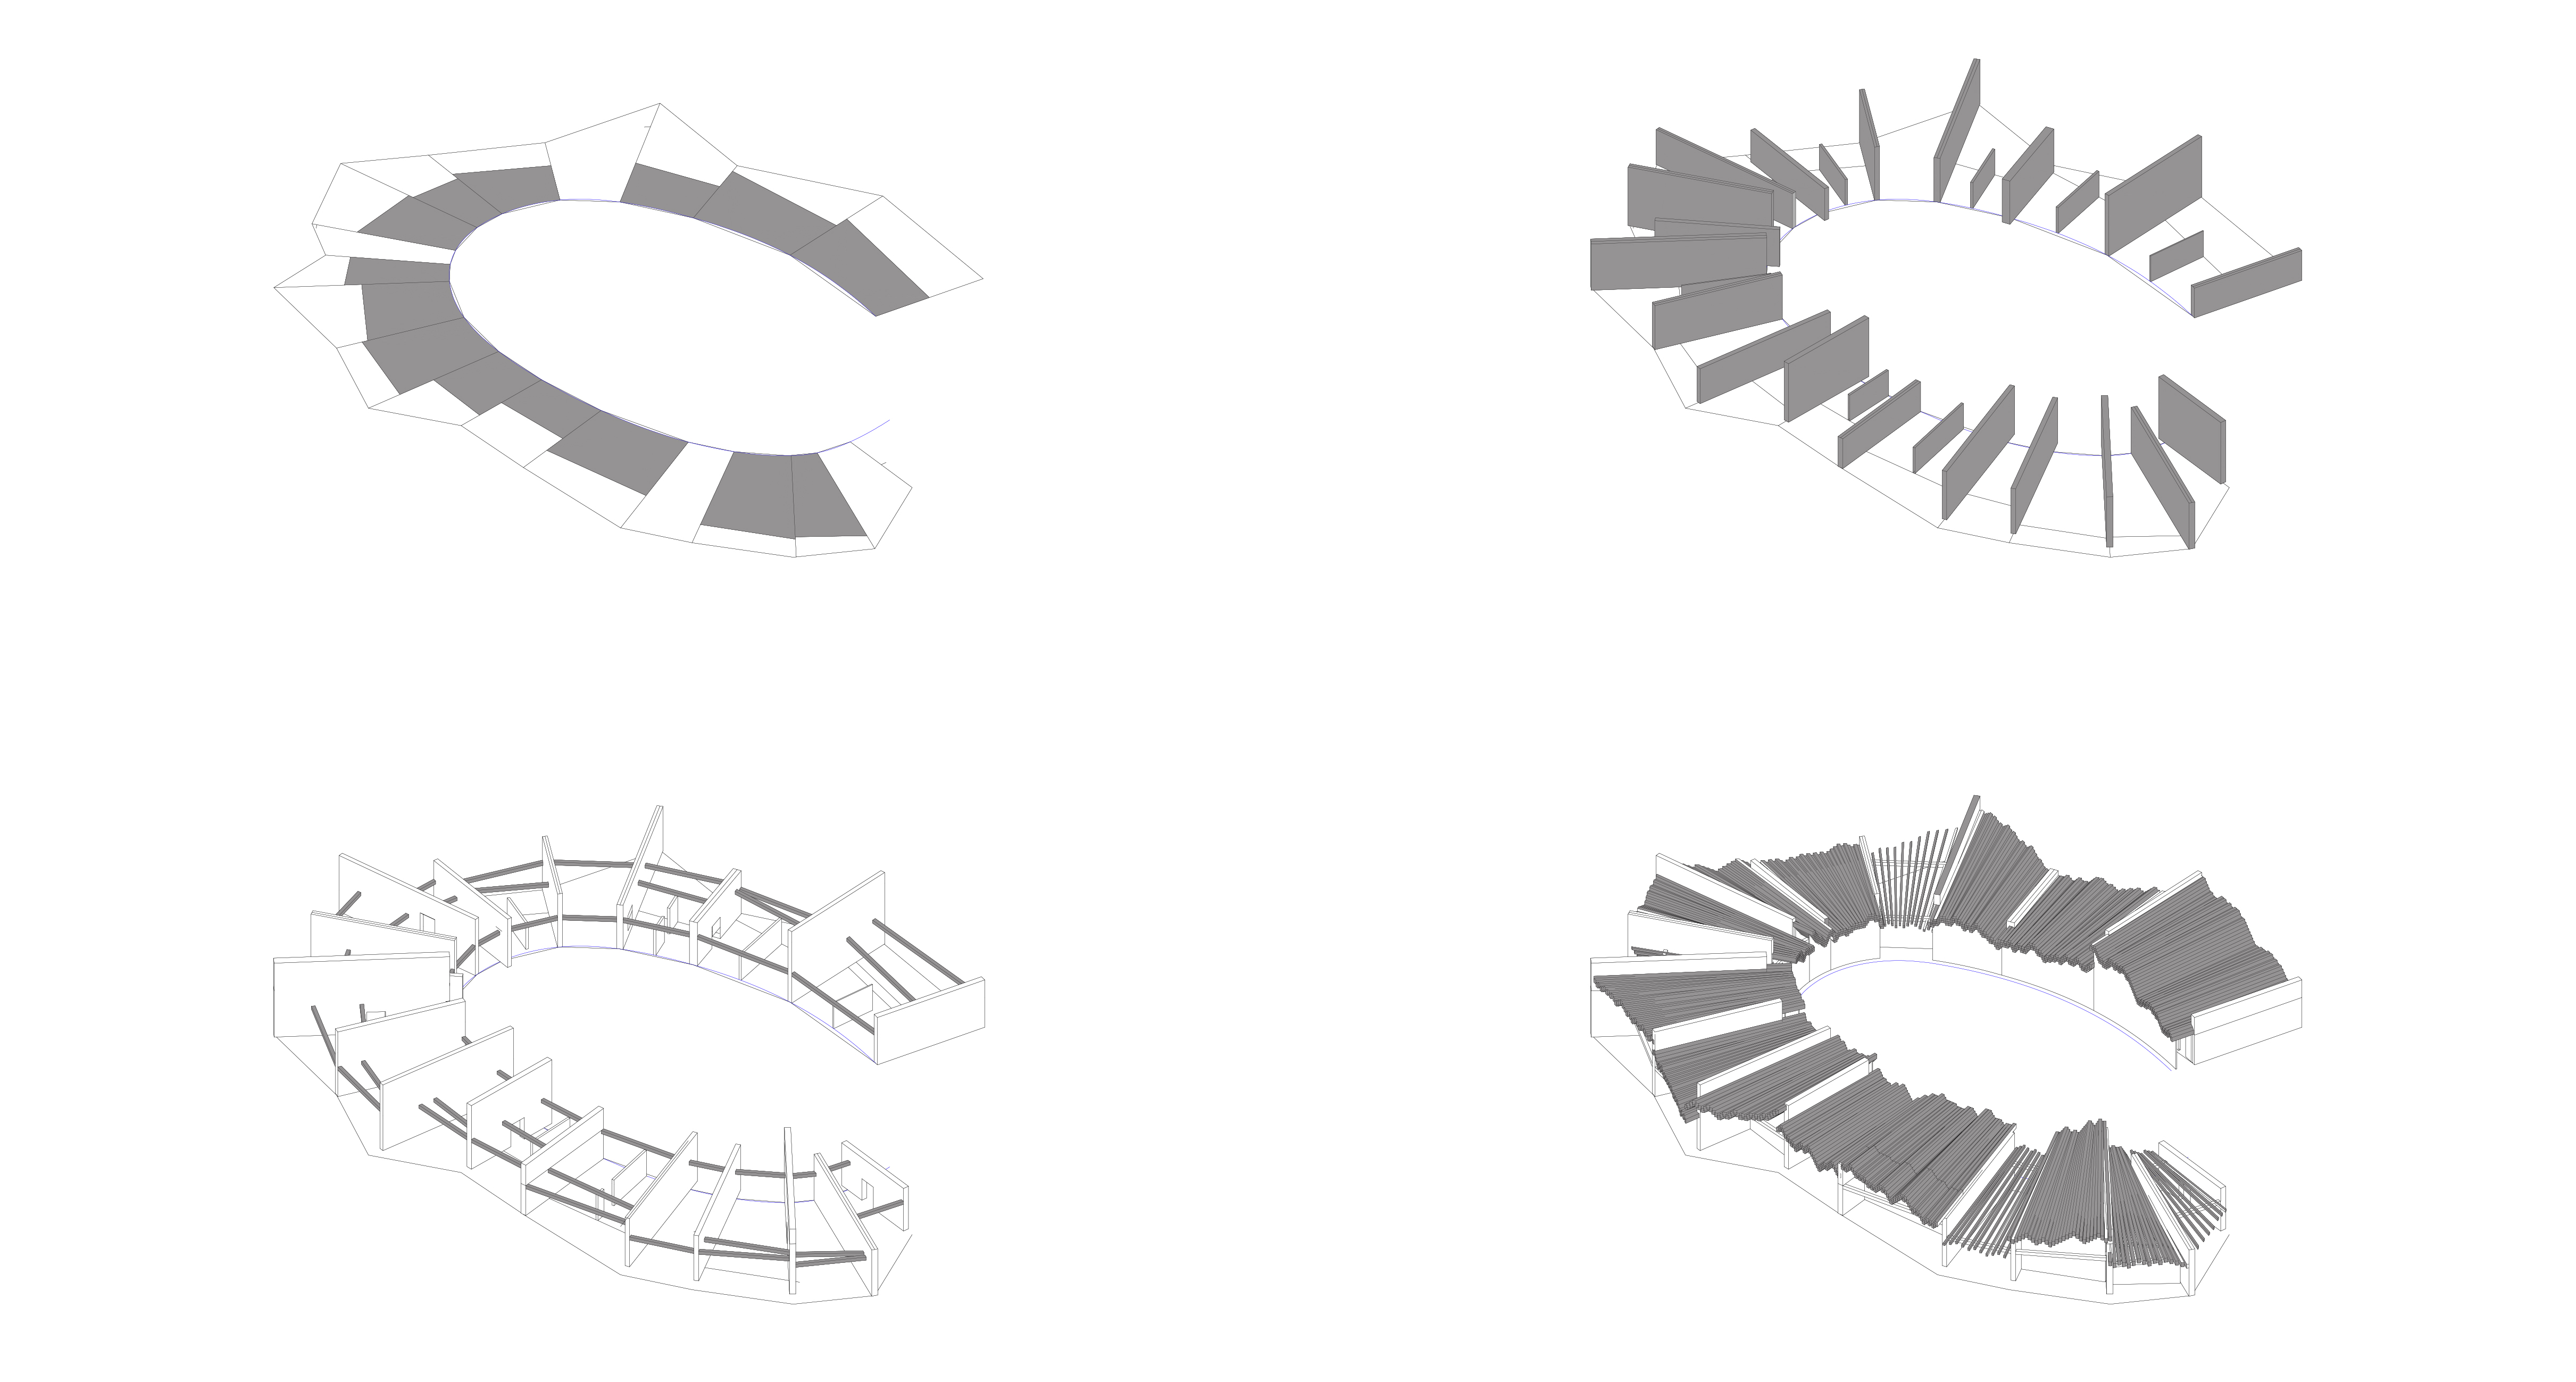
Combining this with my 2-dimensional coding system, I generated an example layout. This created an initial layout in plan and section, along with an axonometric view of the roof, allowing me to begin to see how the interior spaces could develop.

B

B2

B3

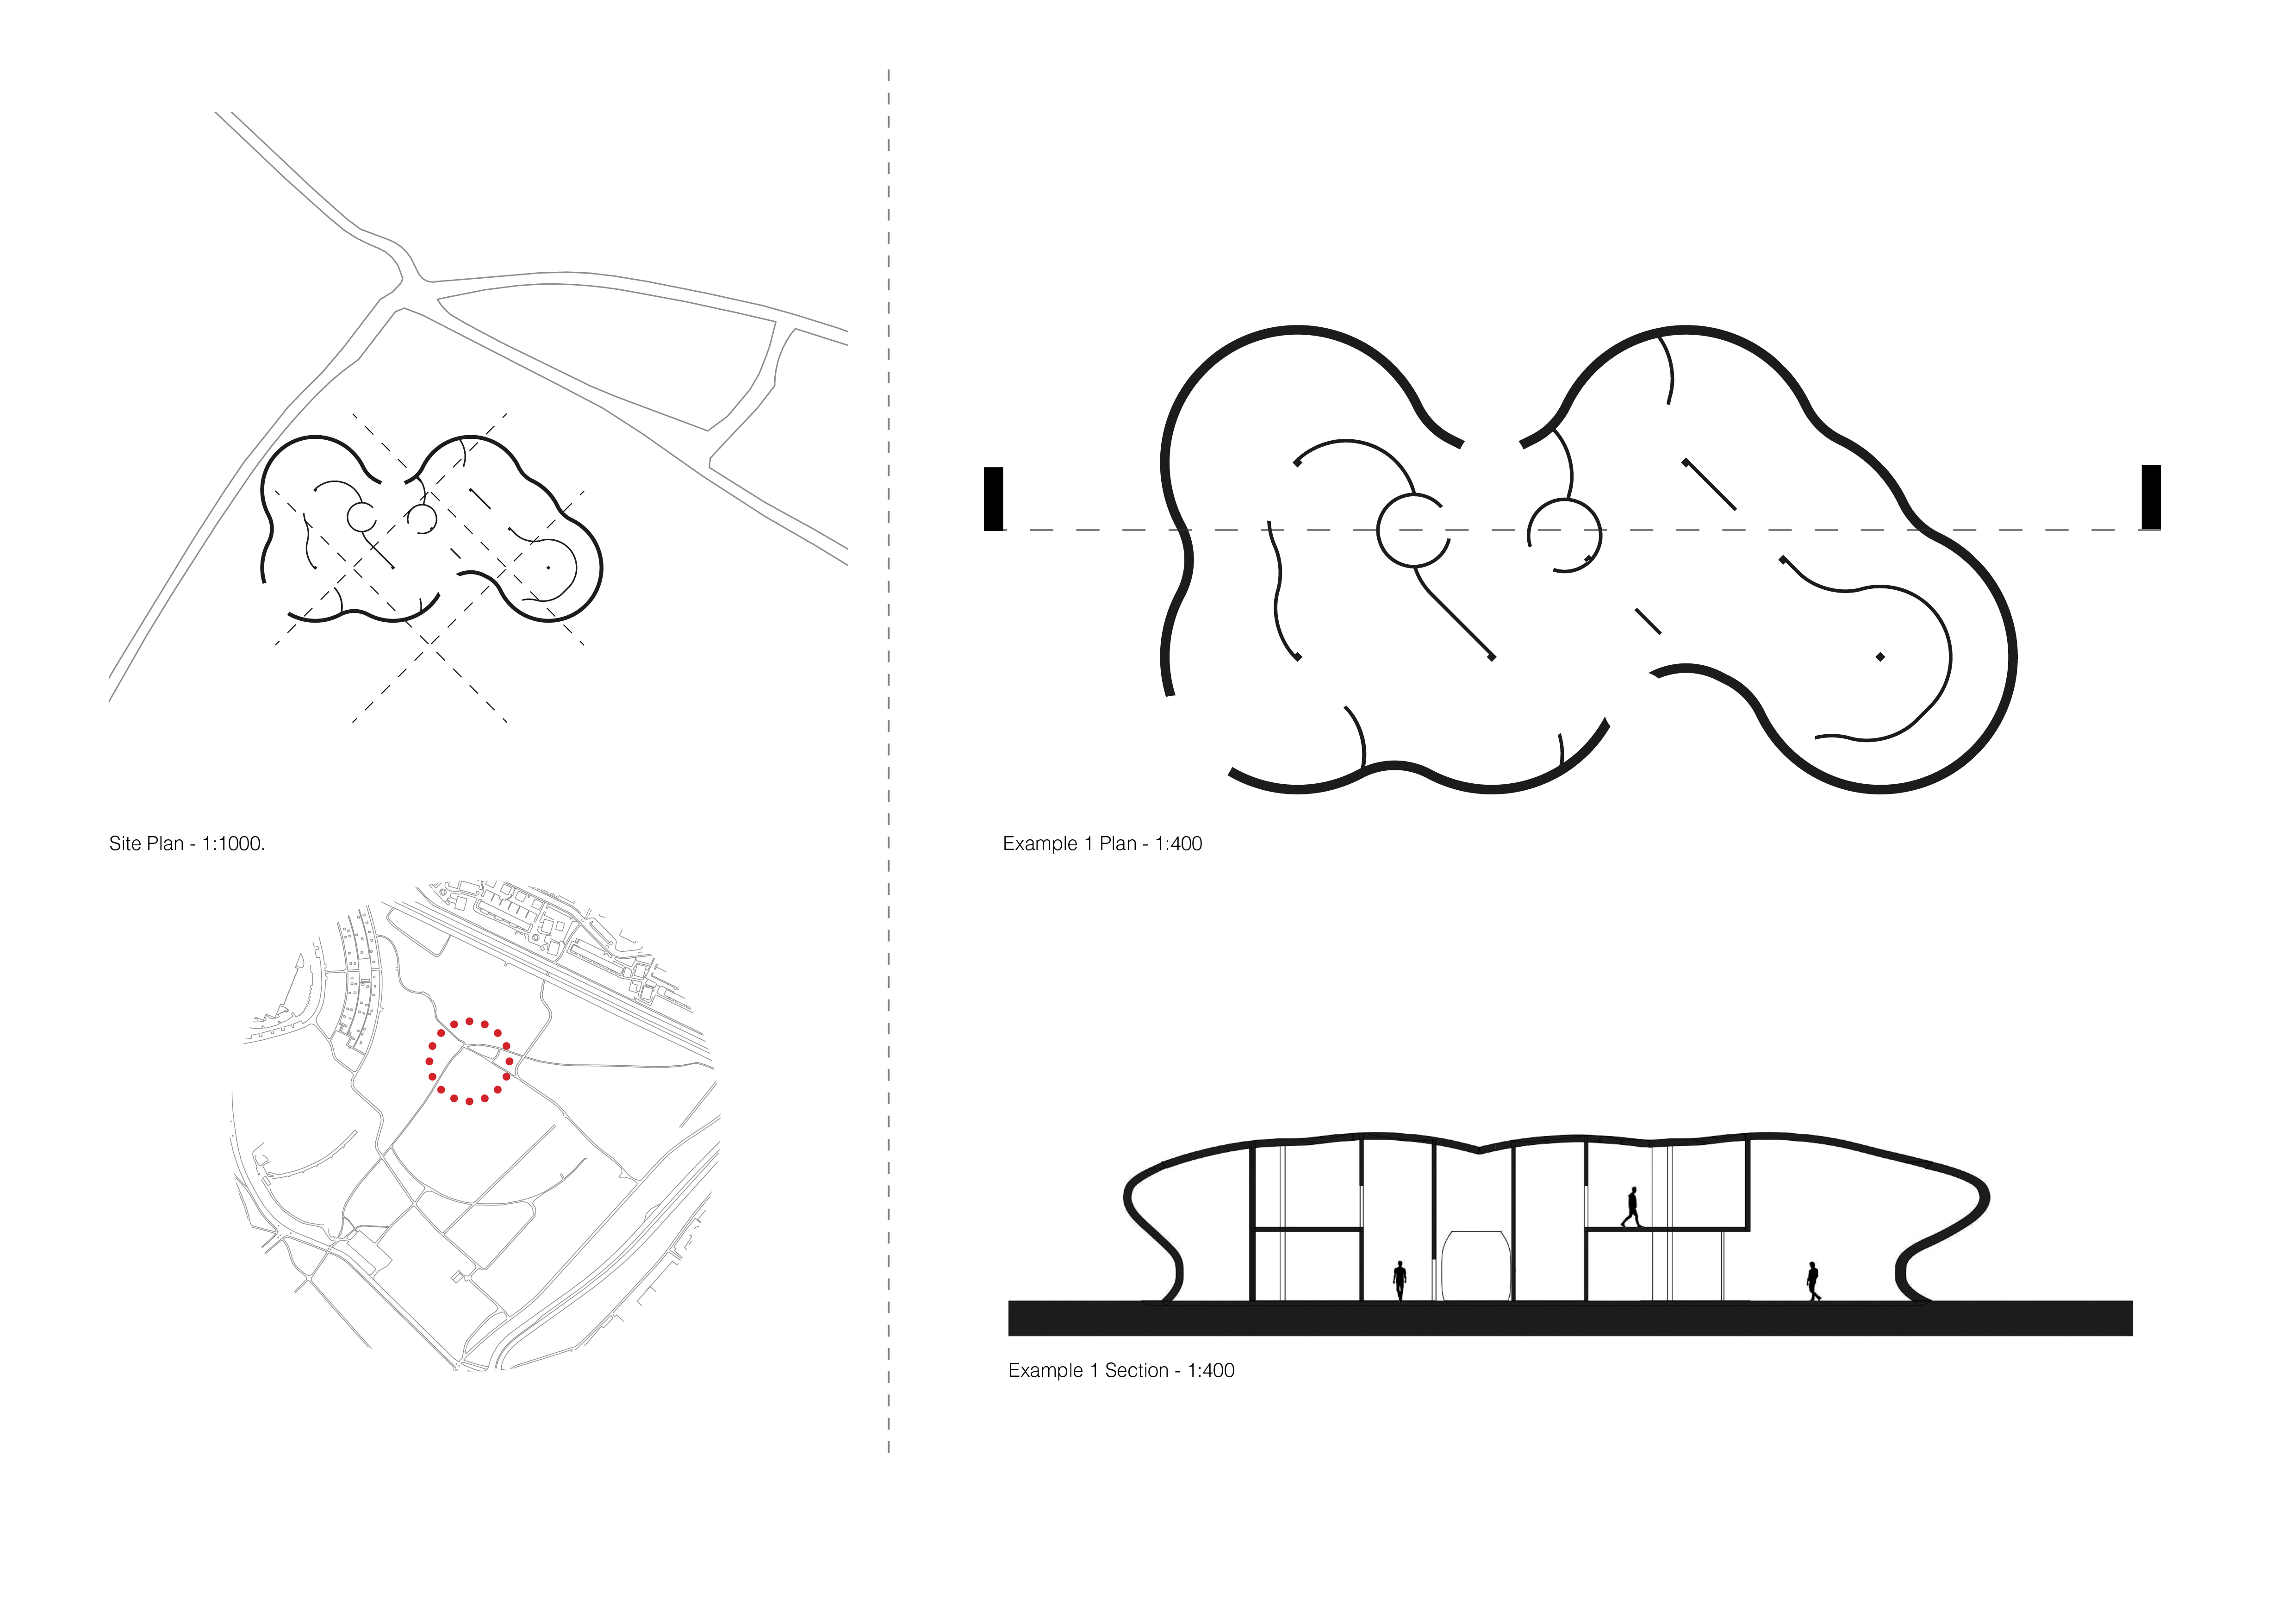
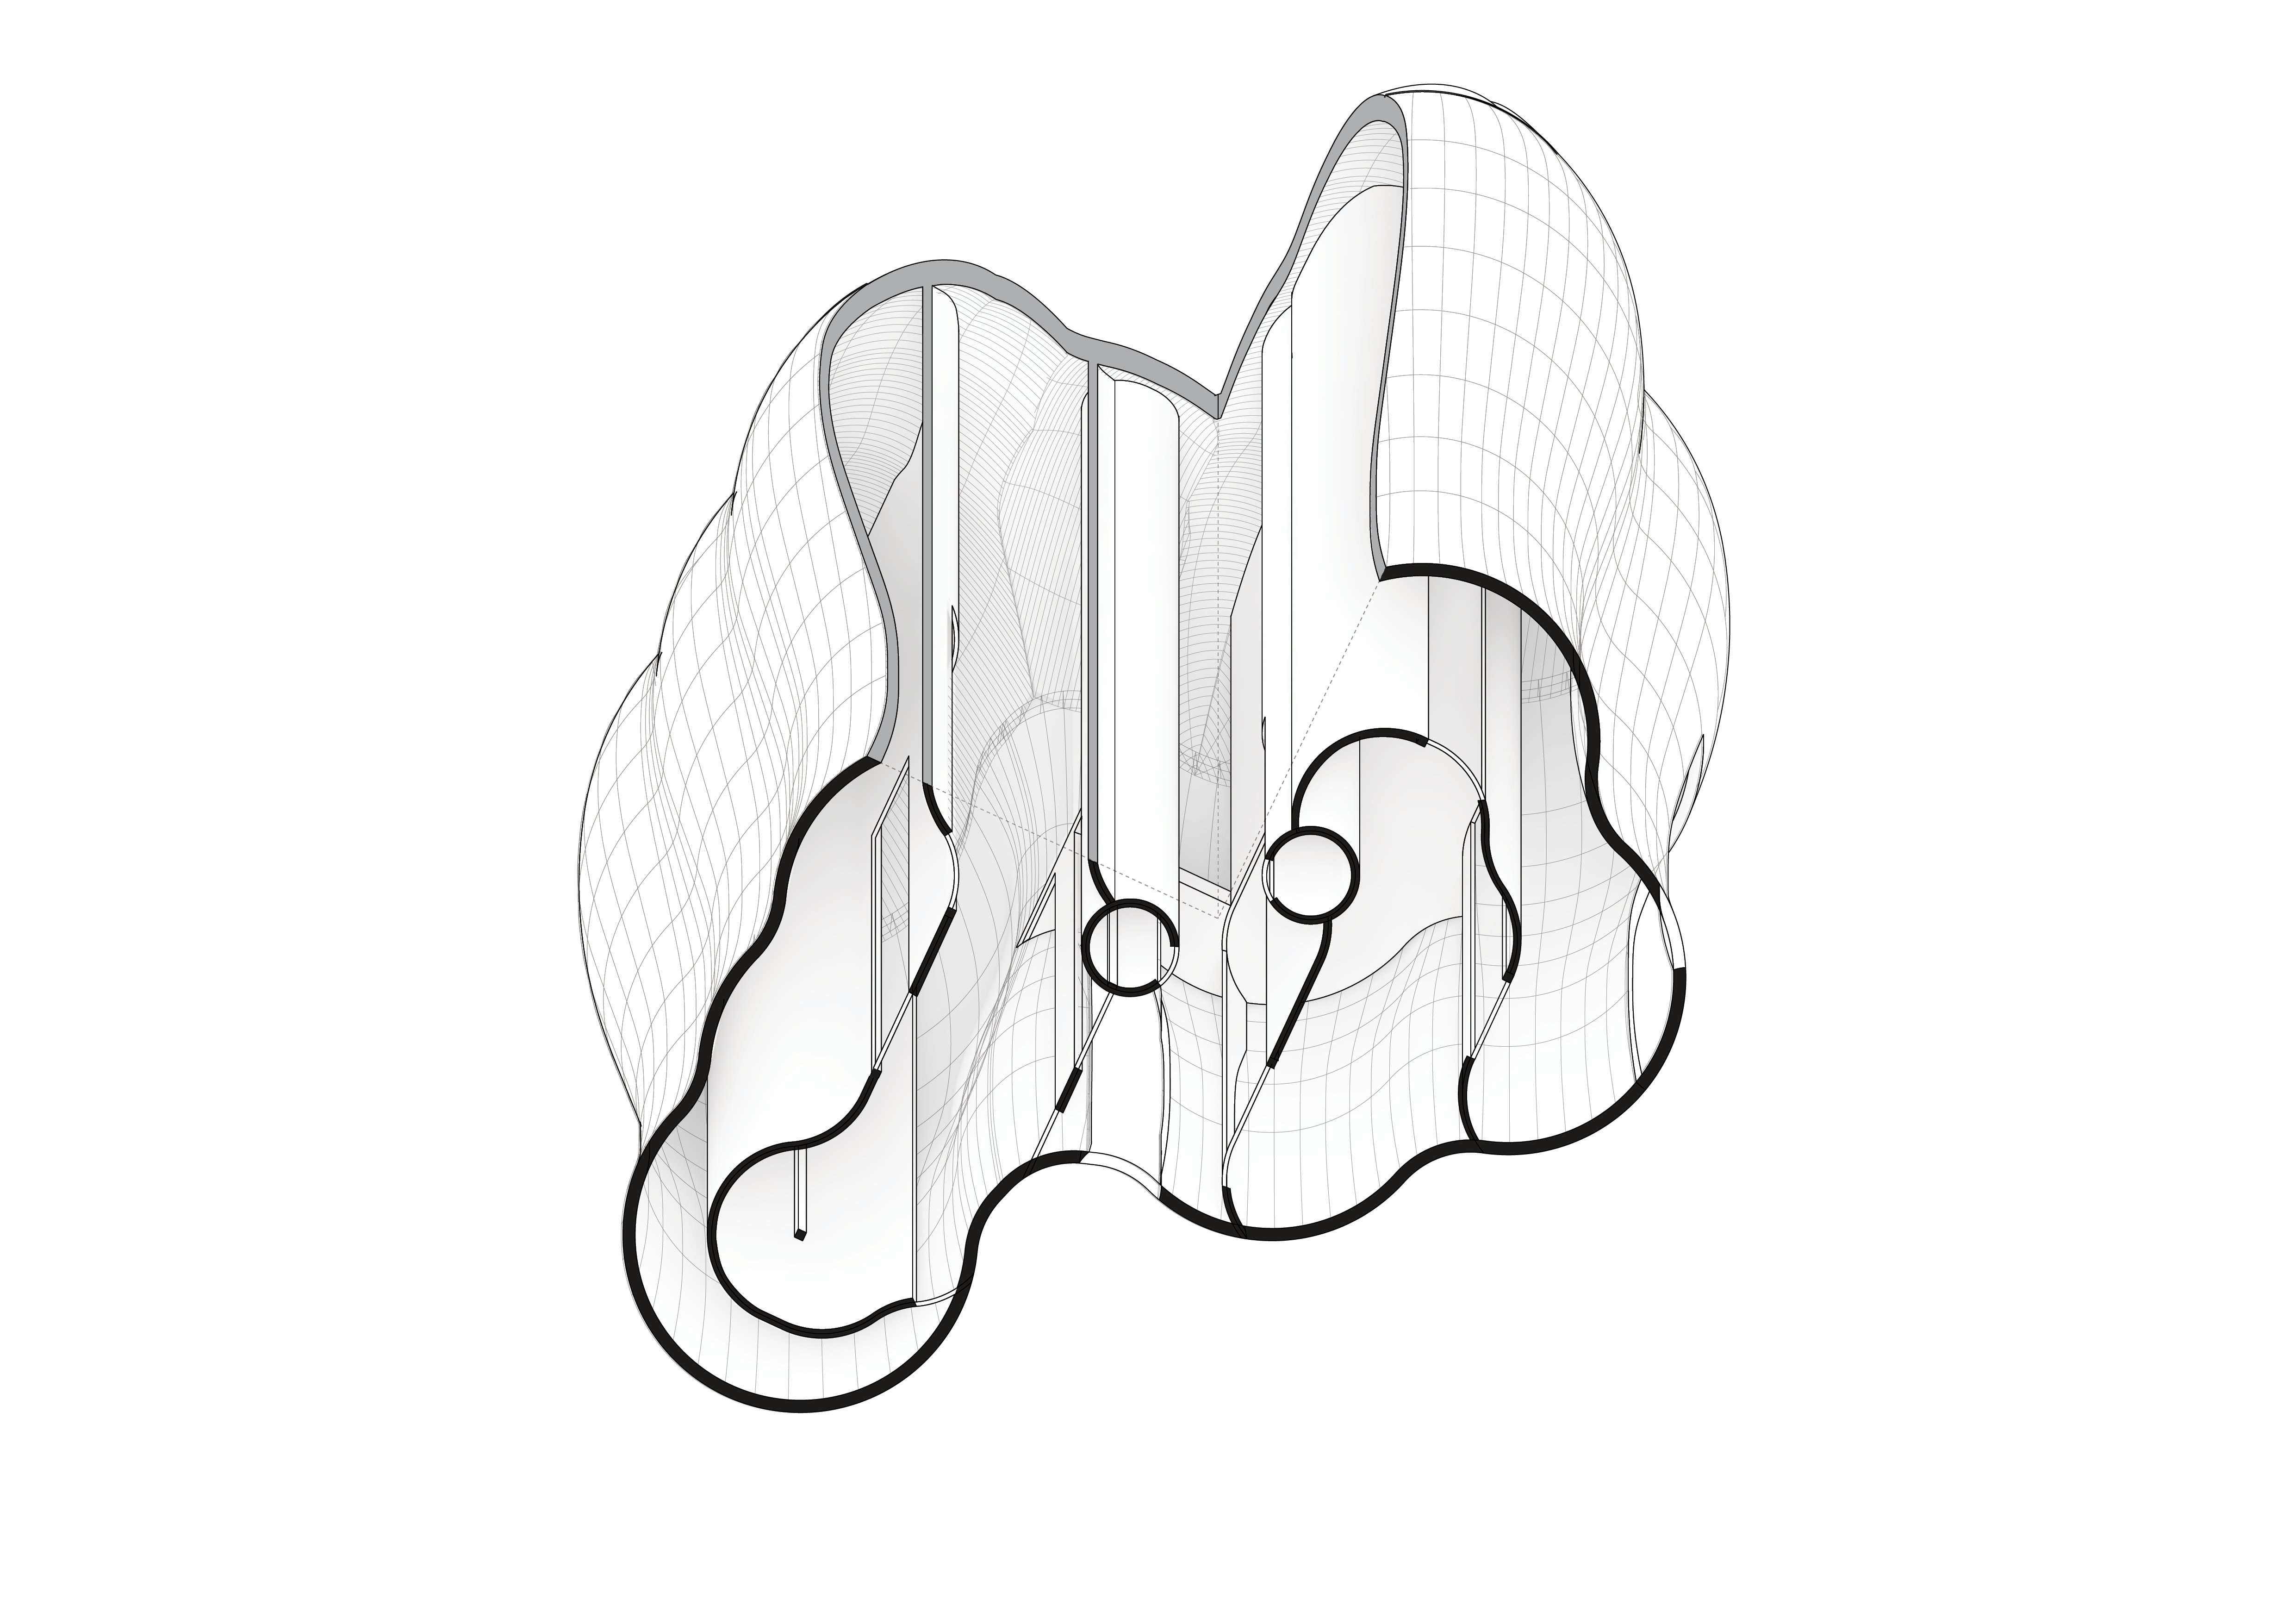
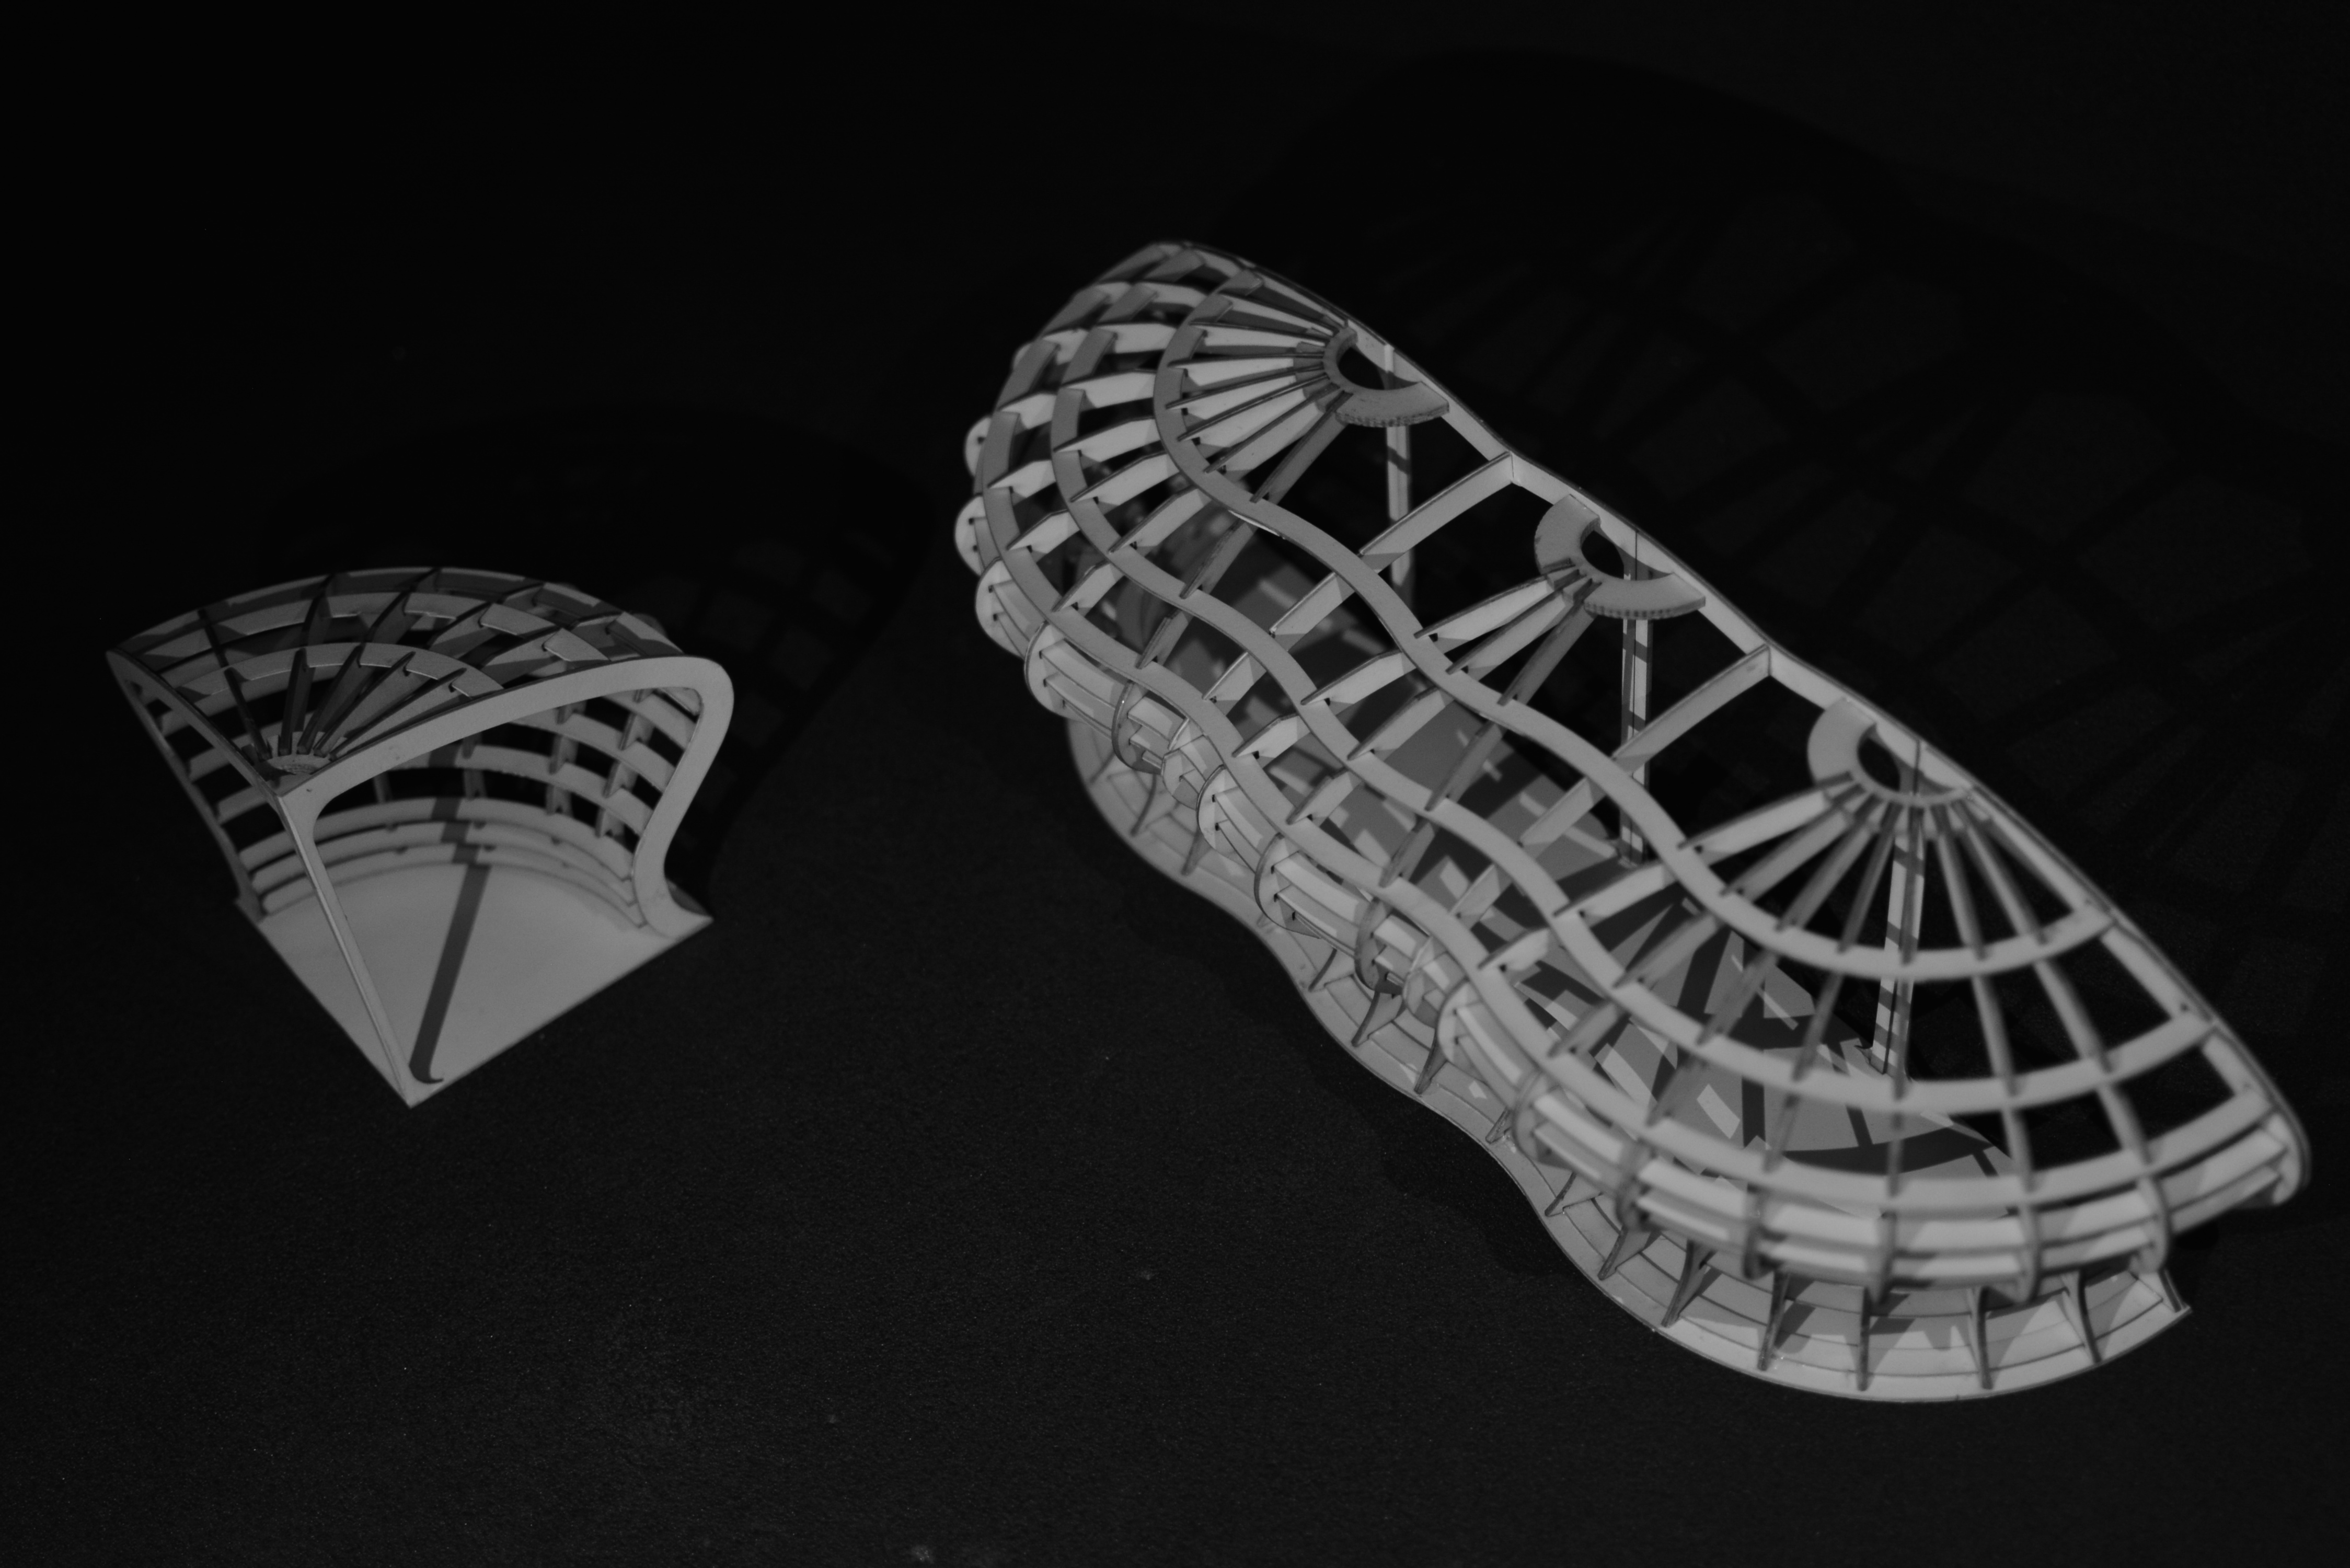
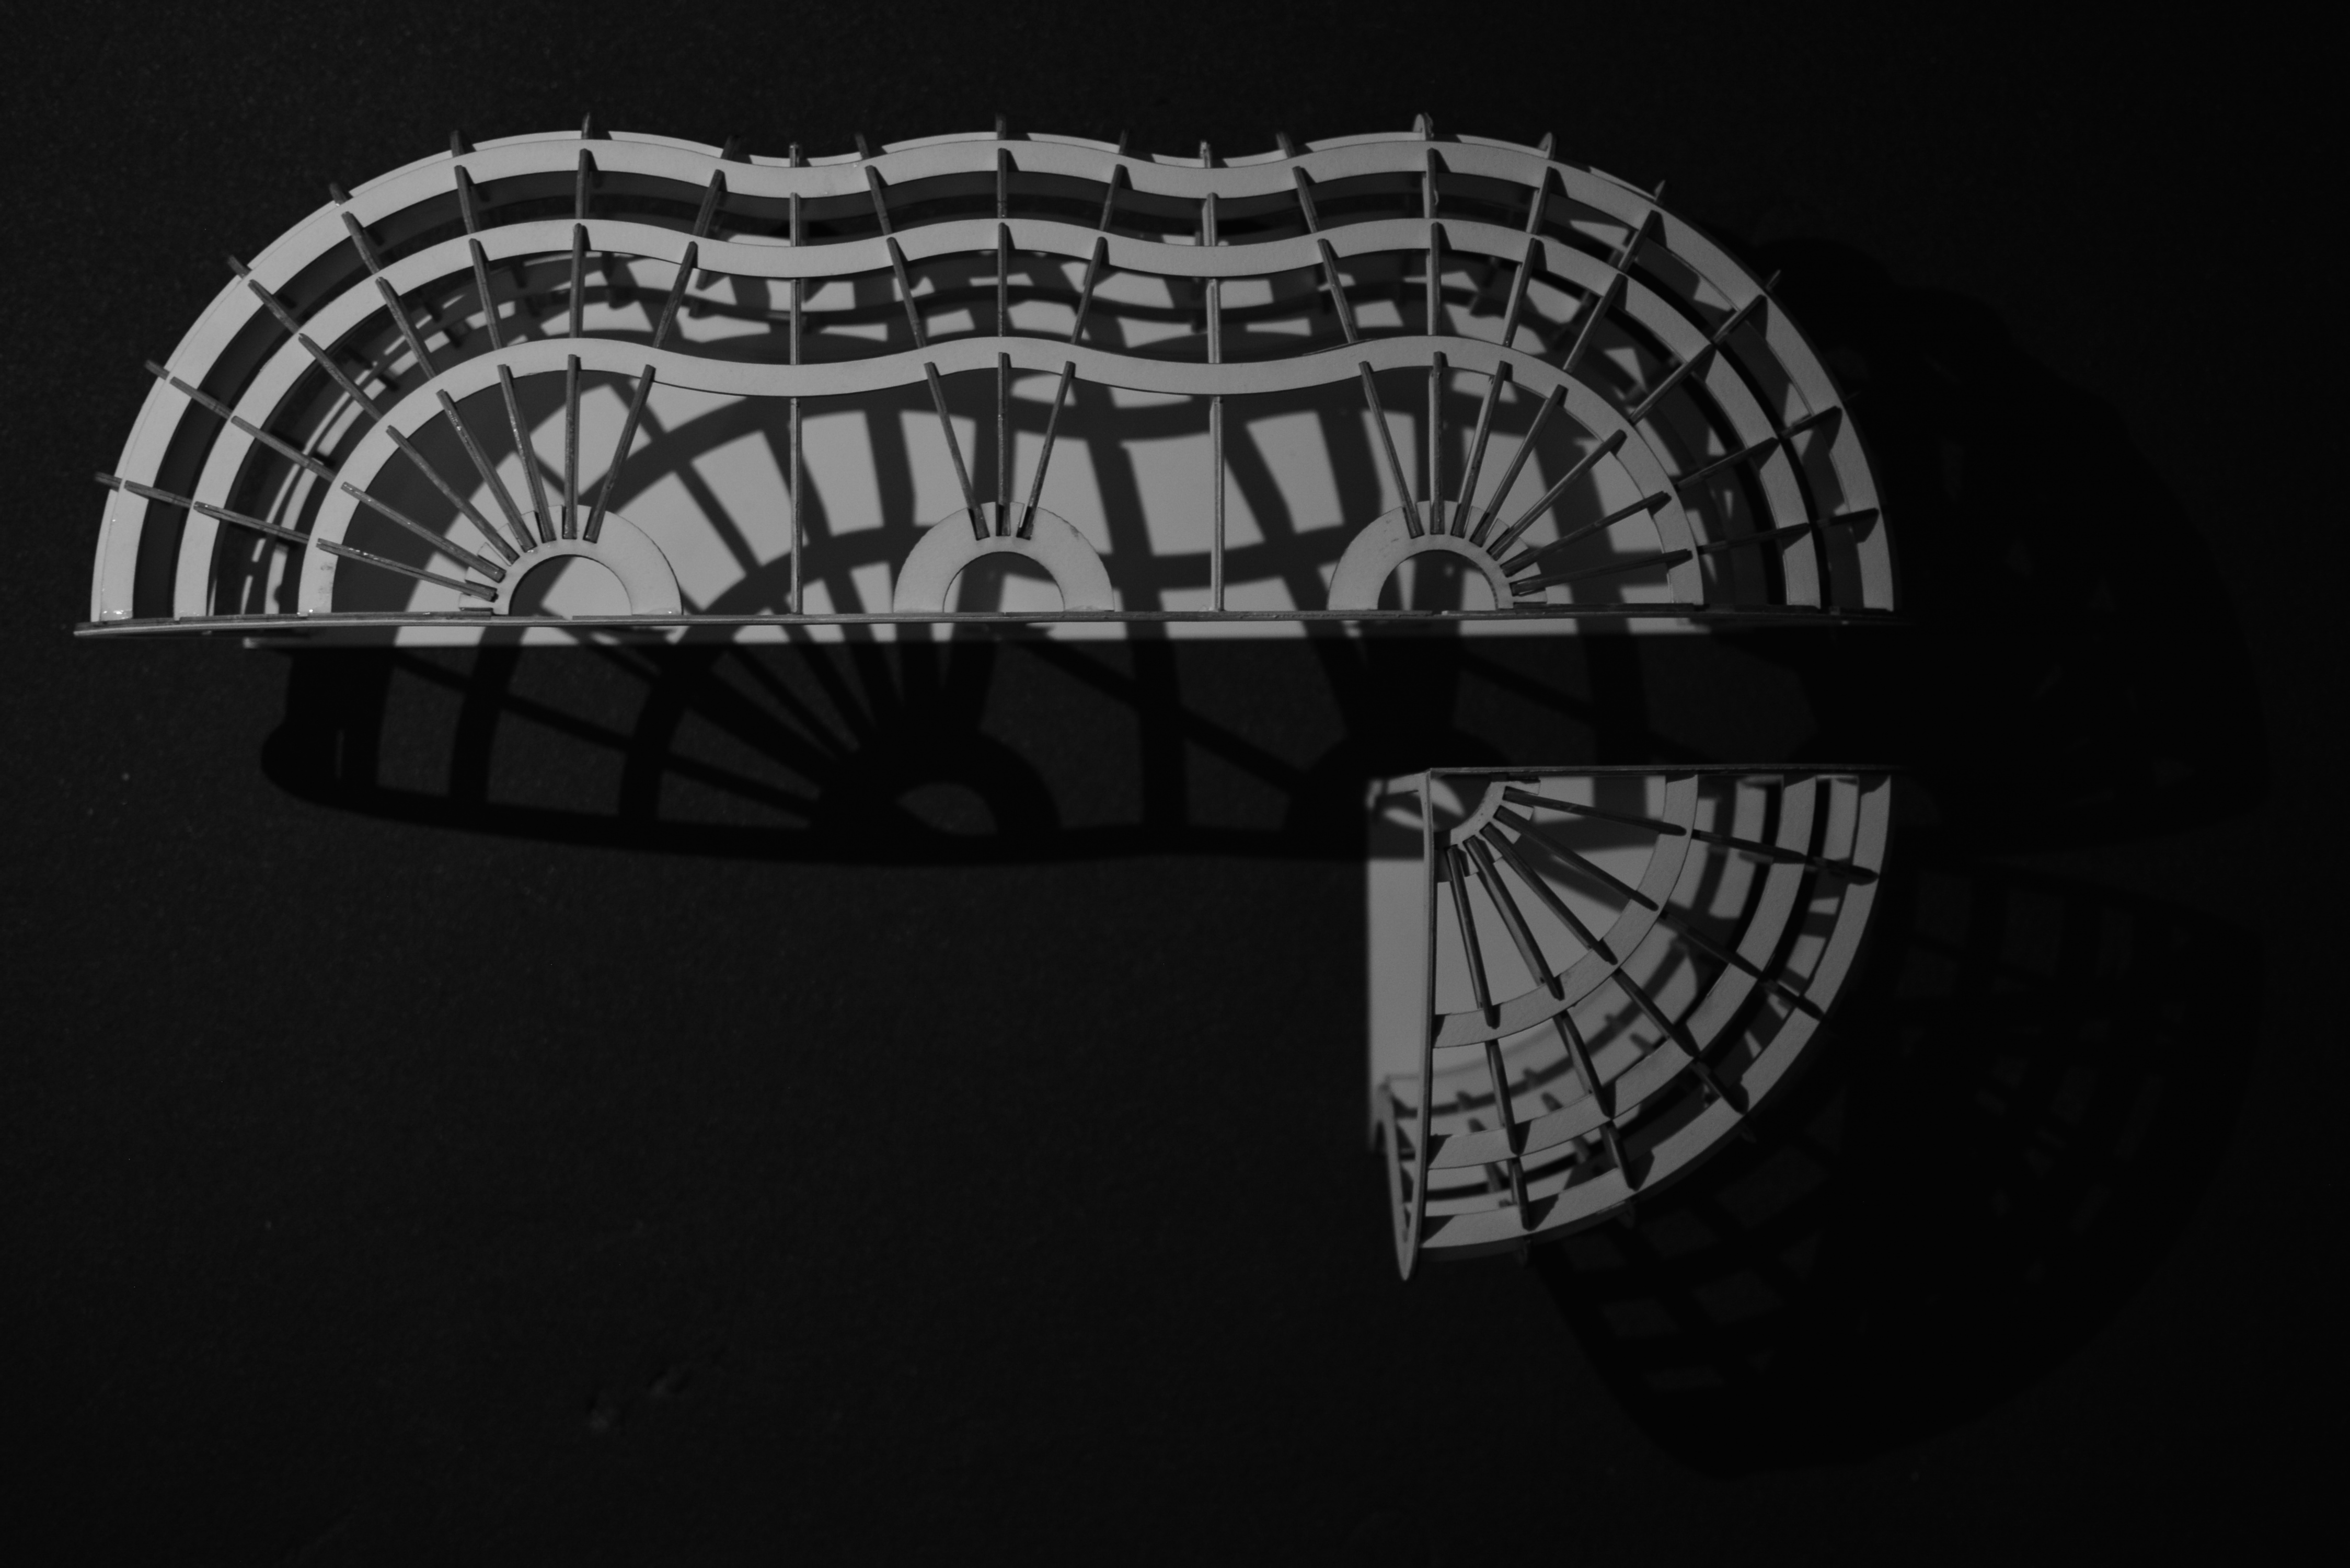
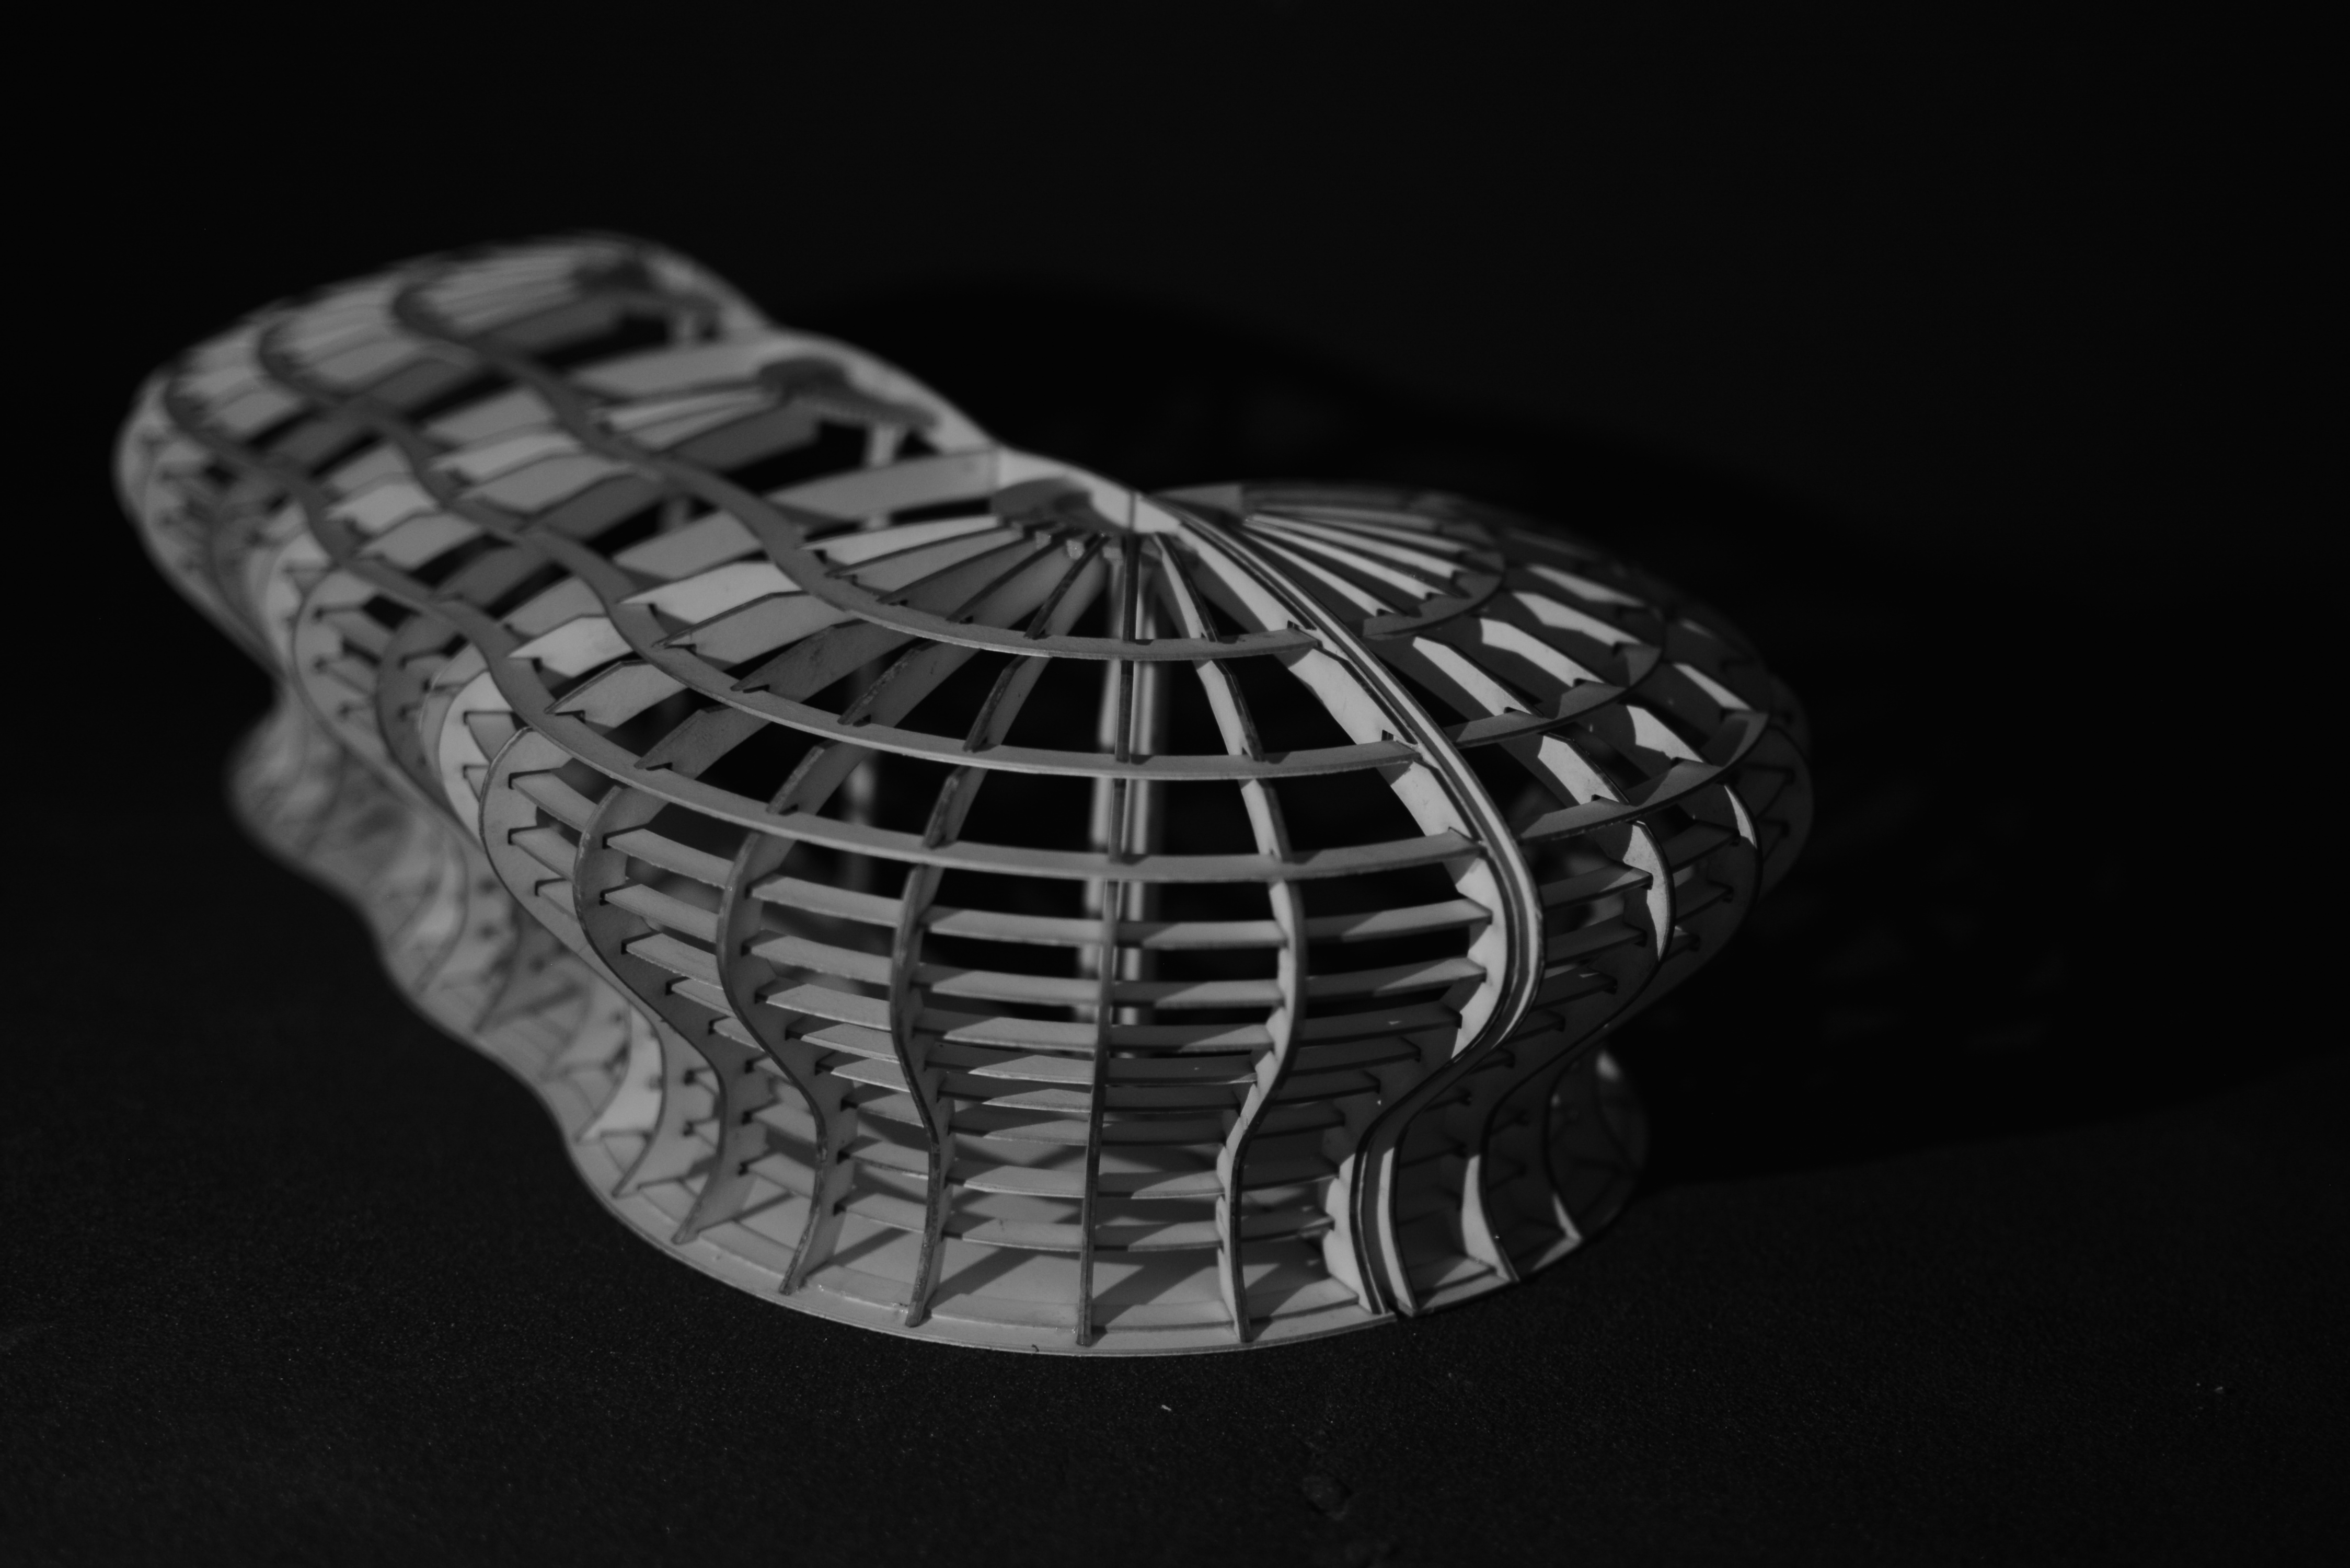
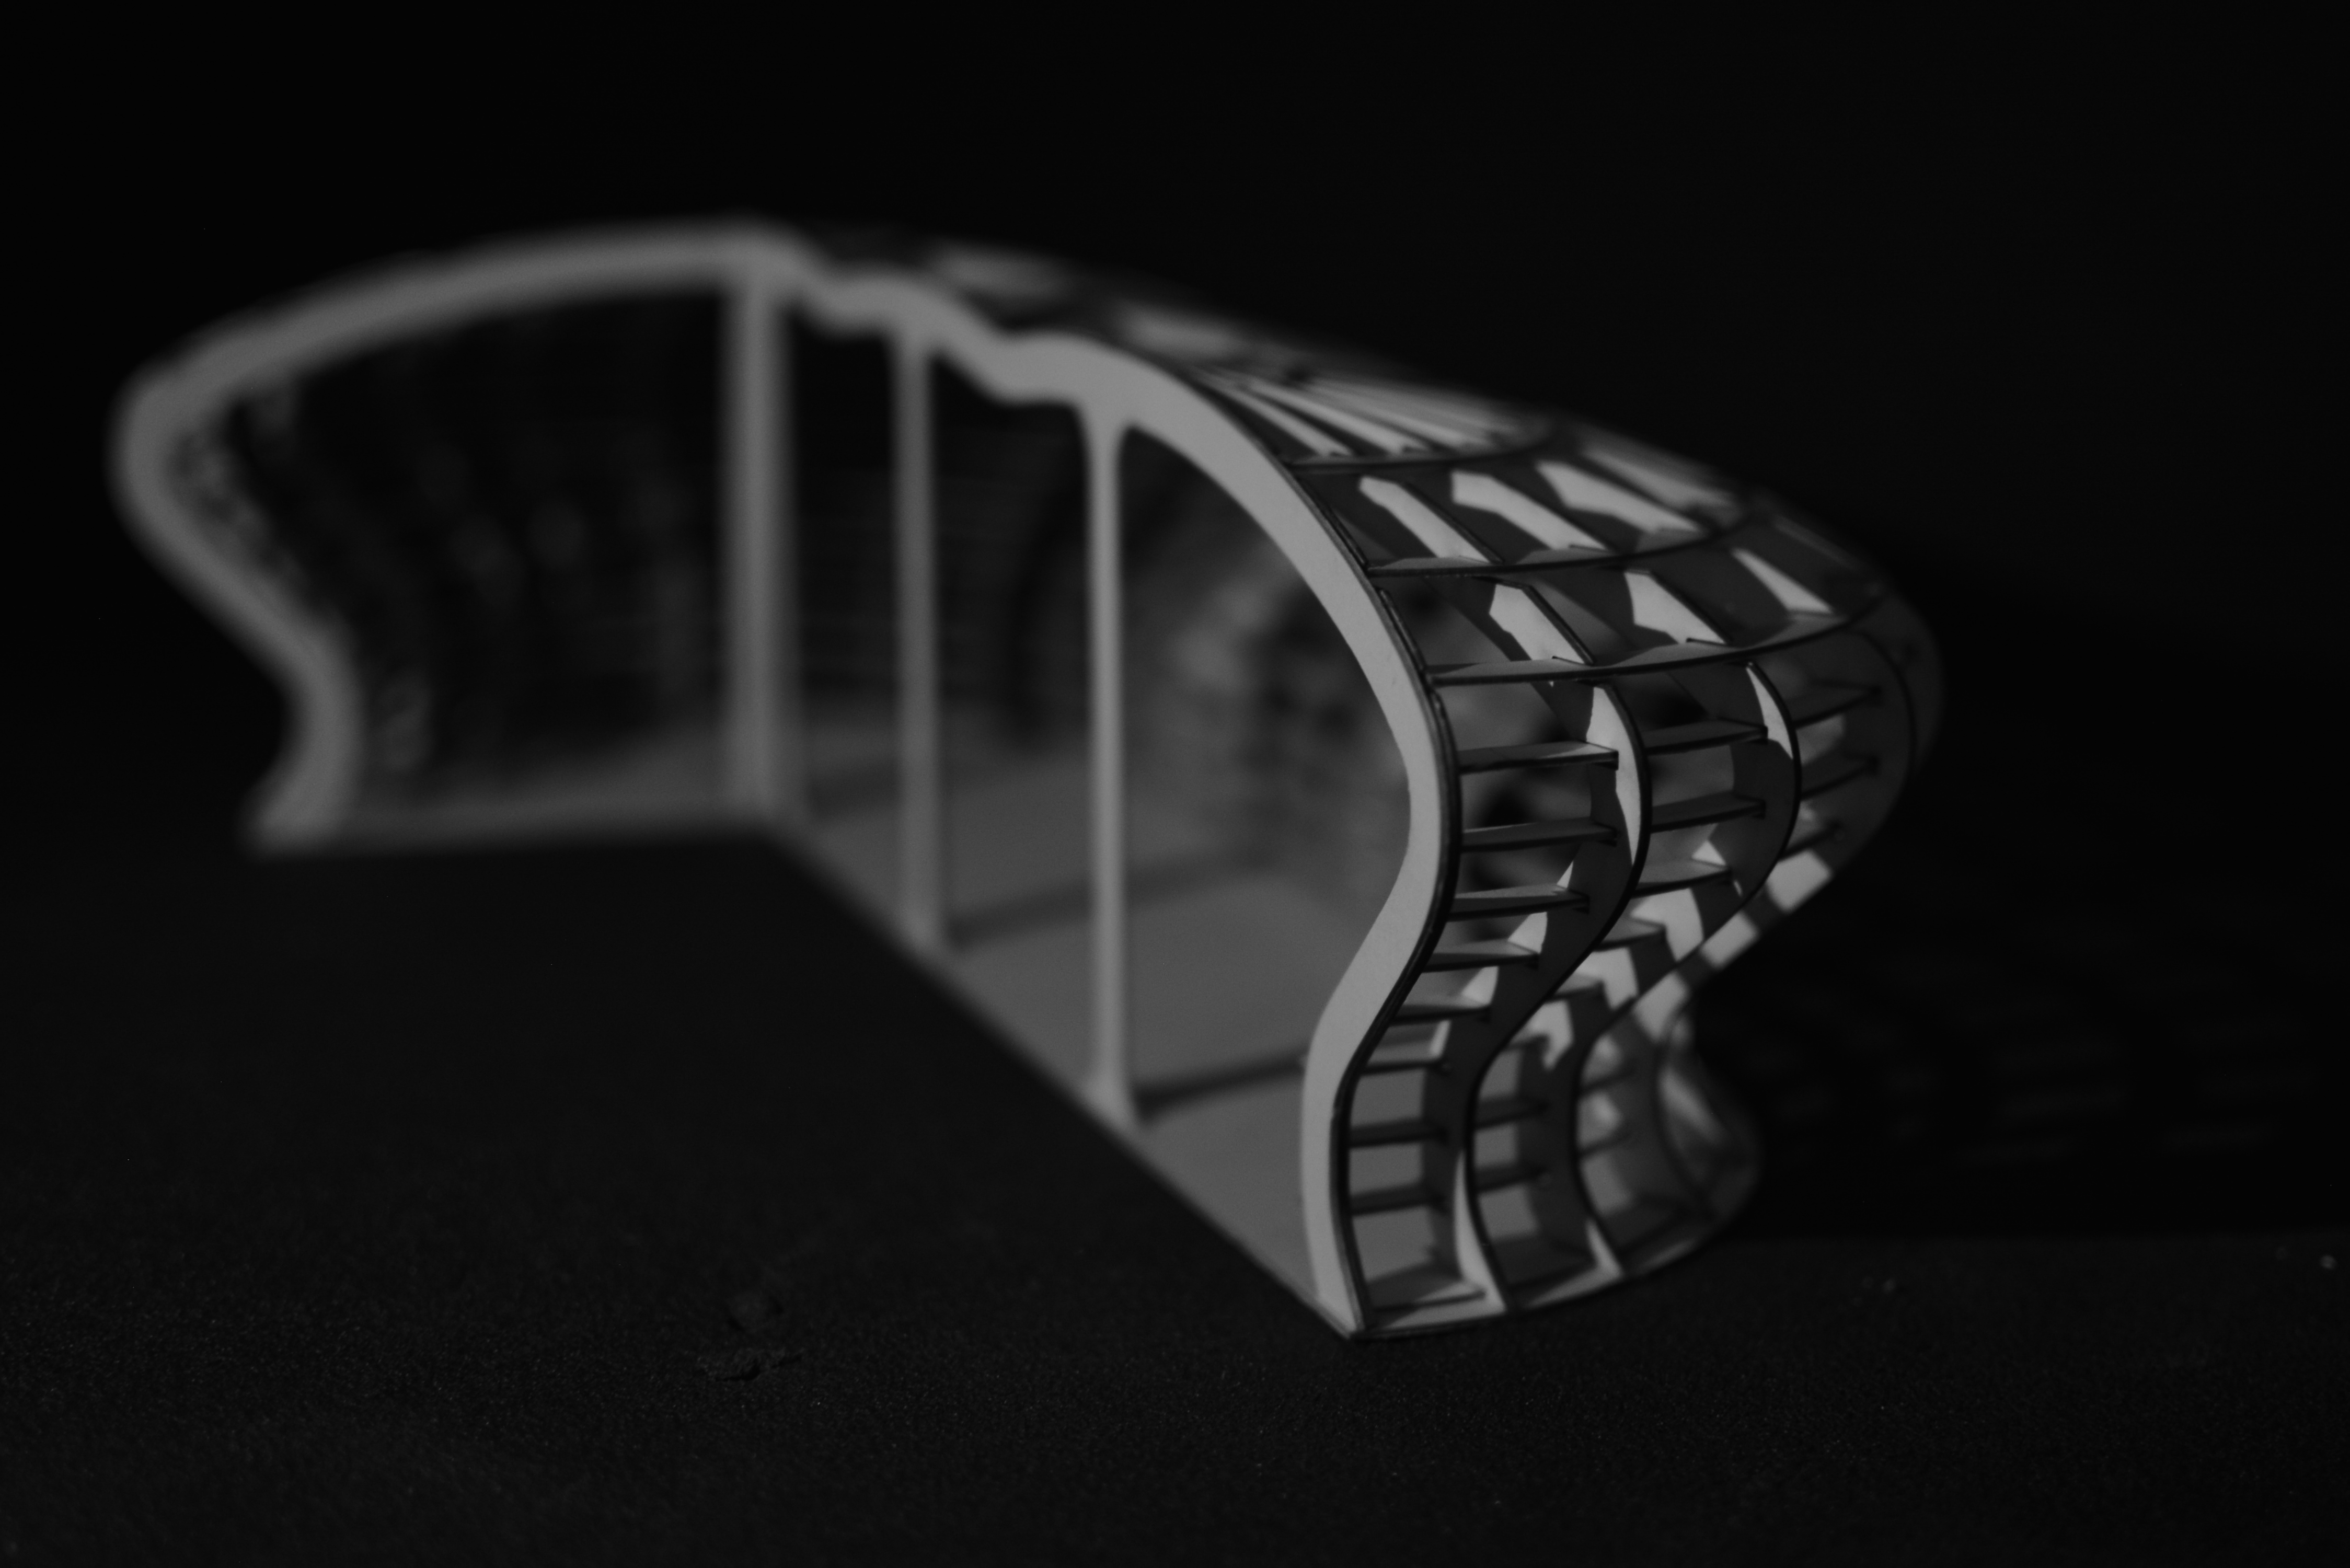
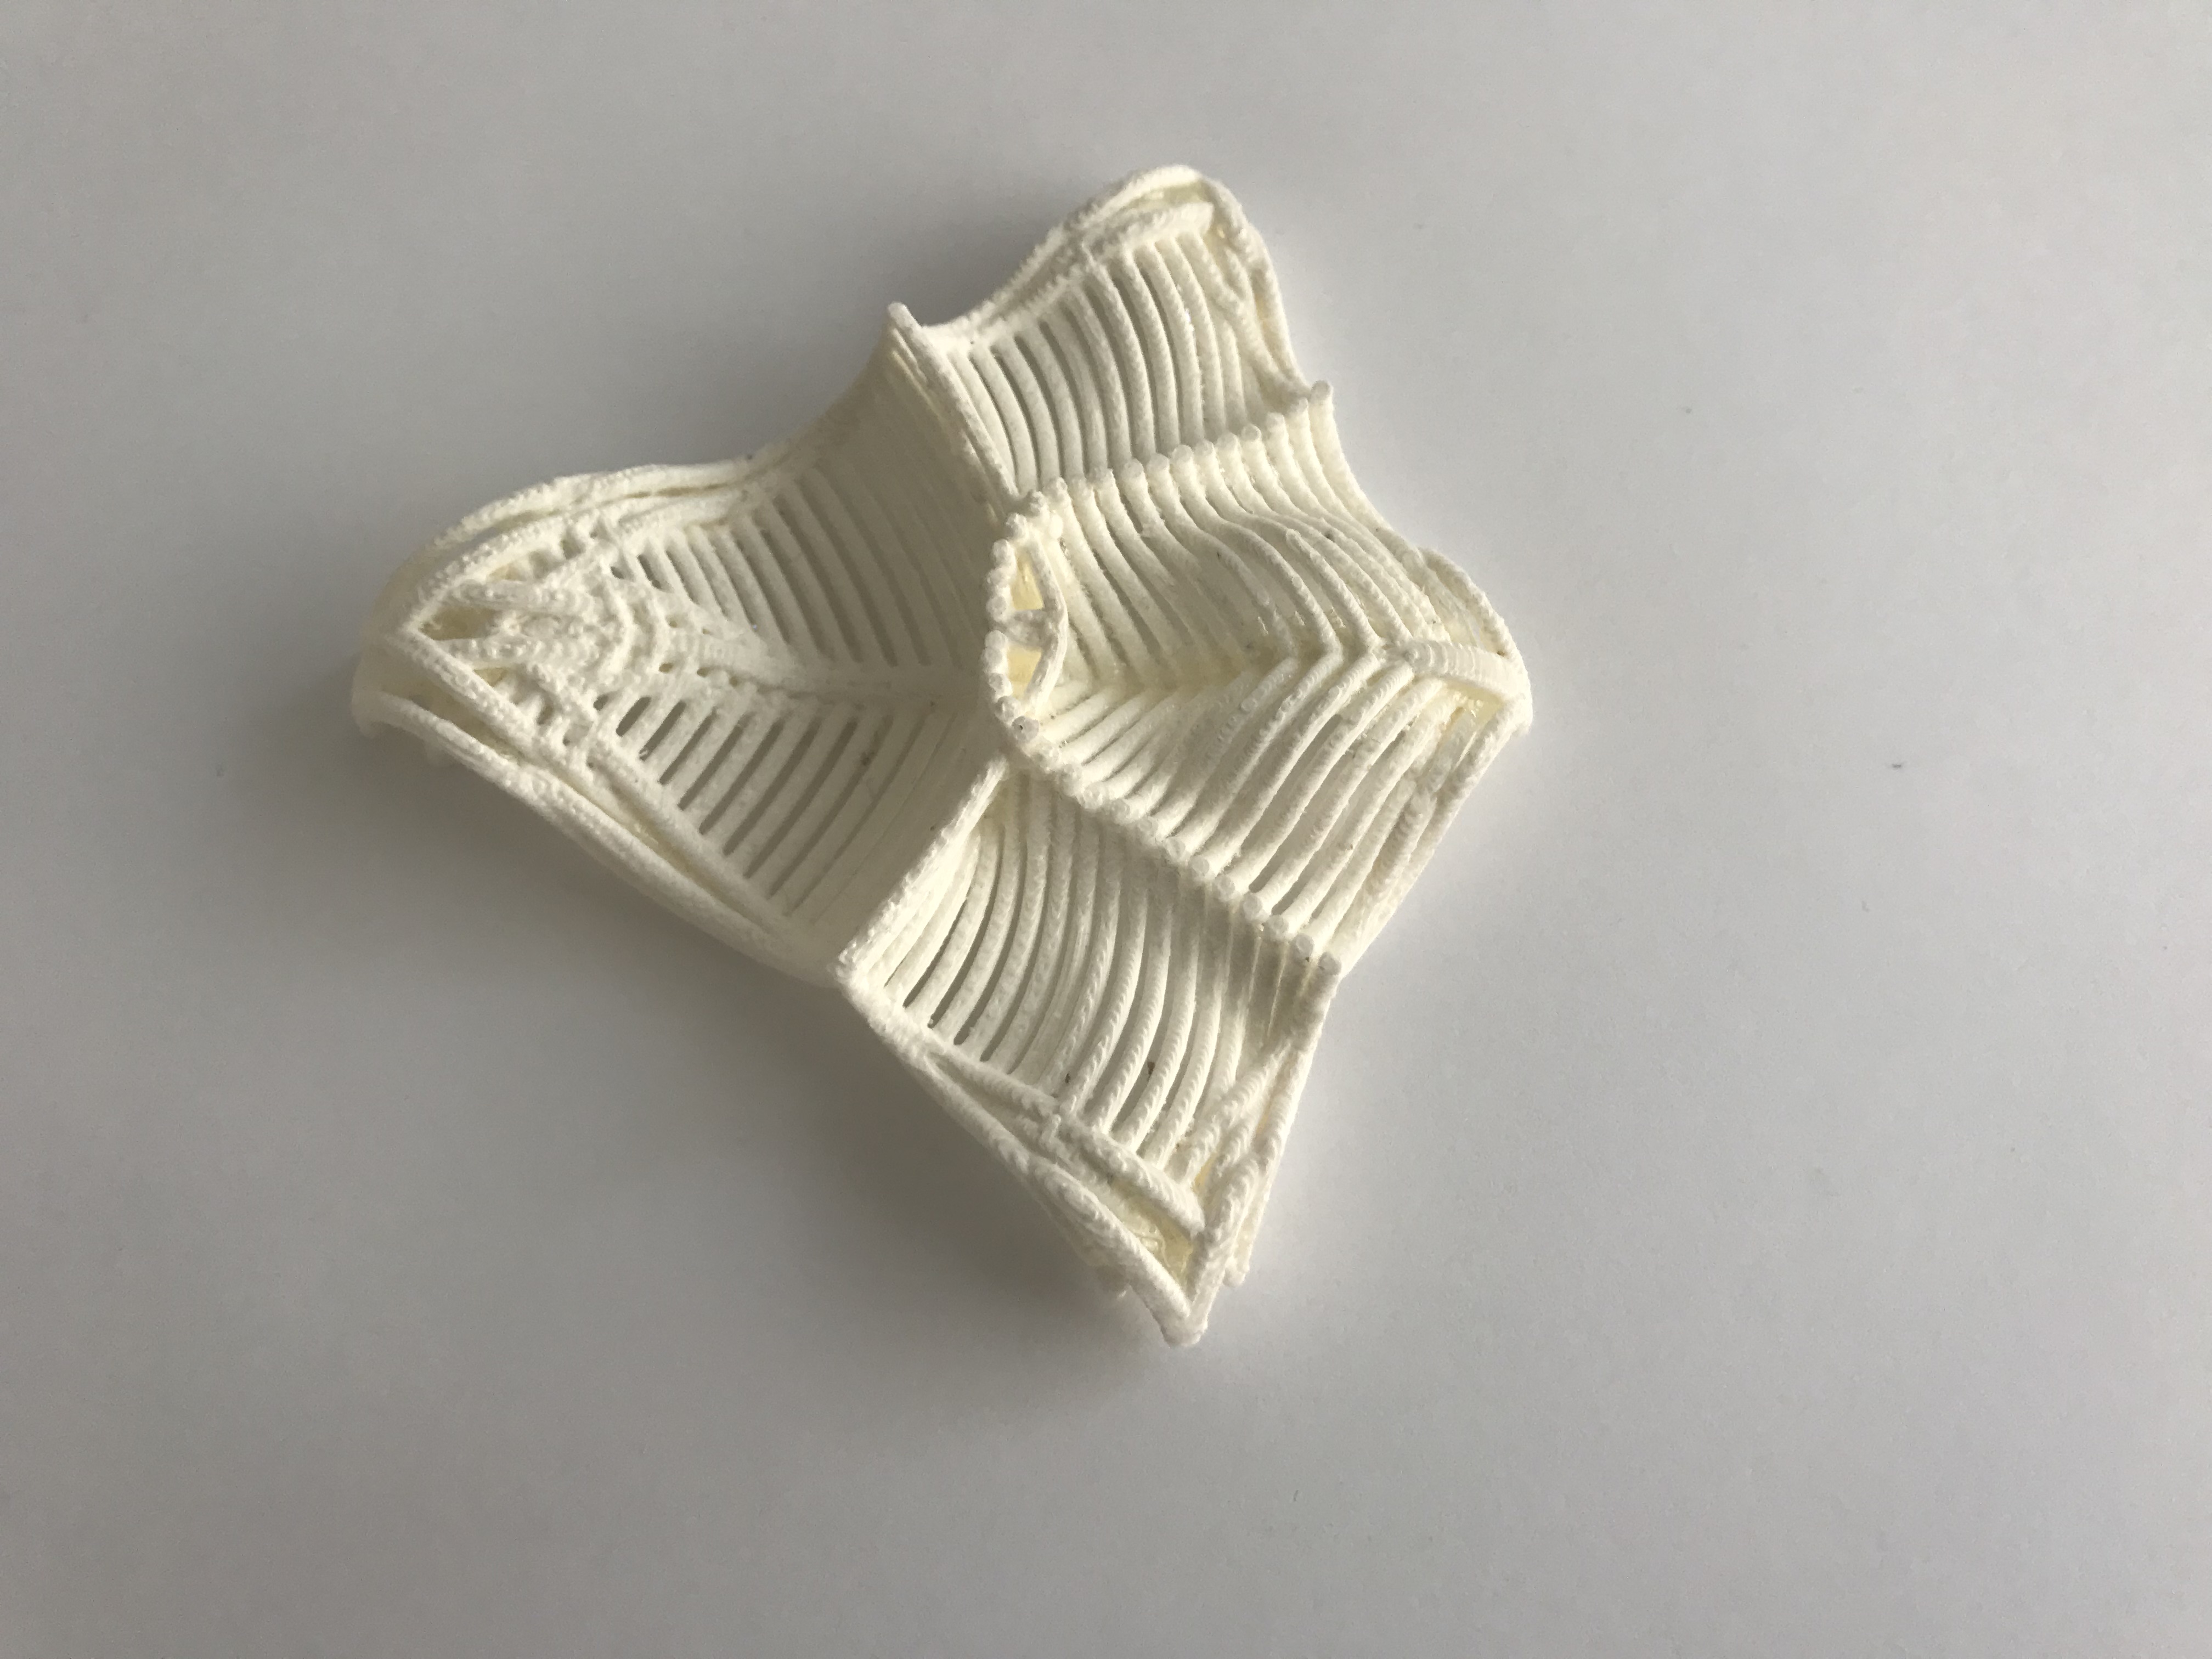
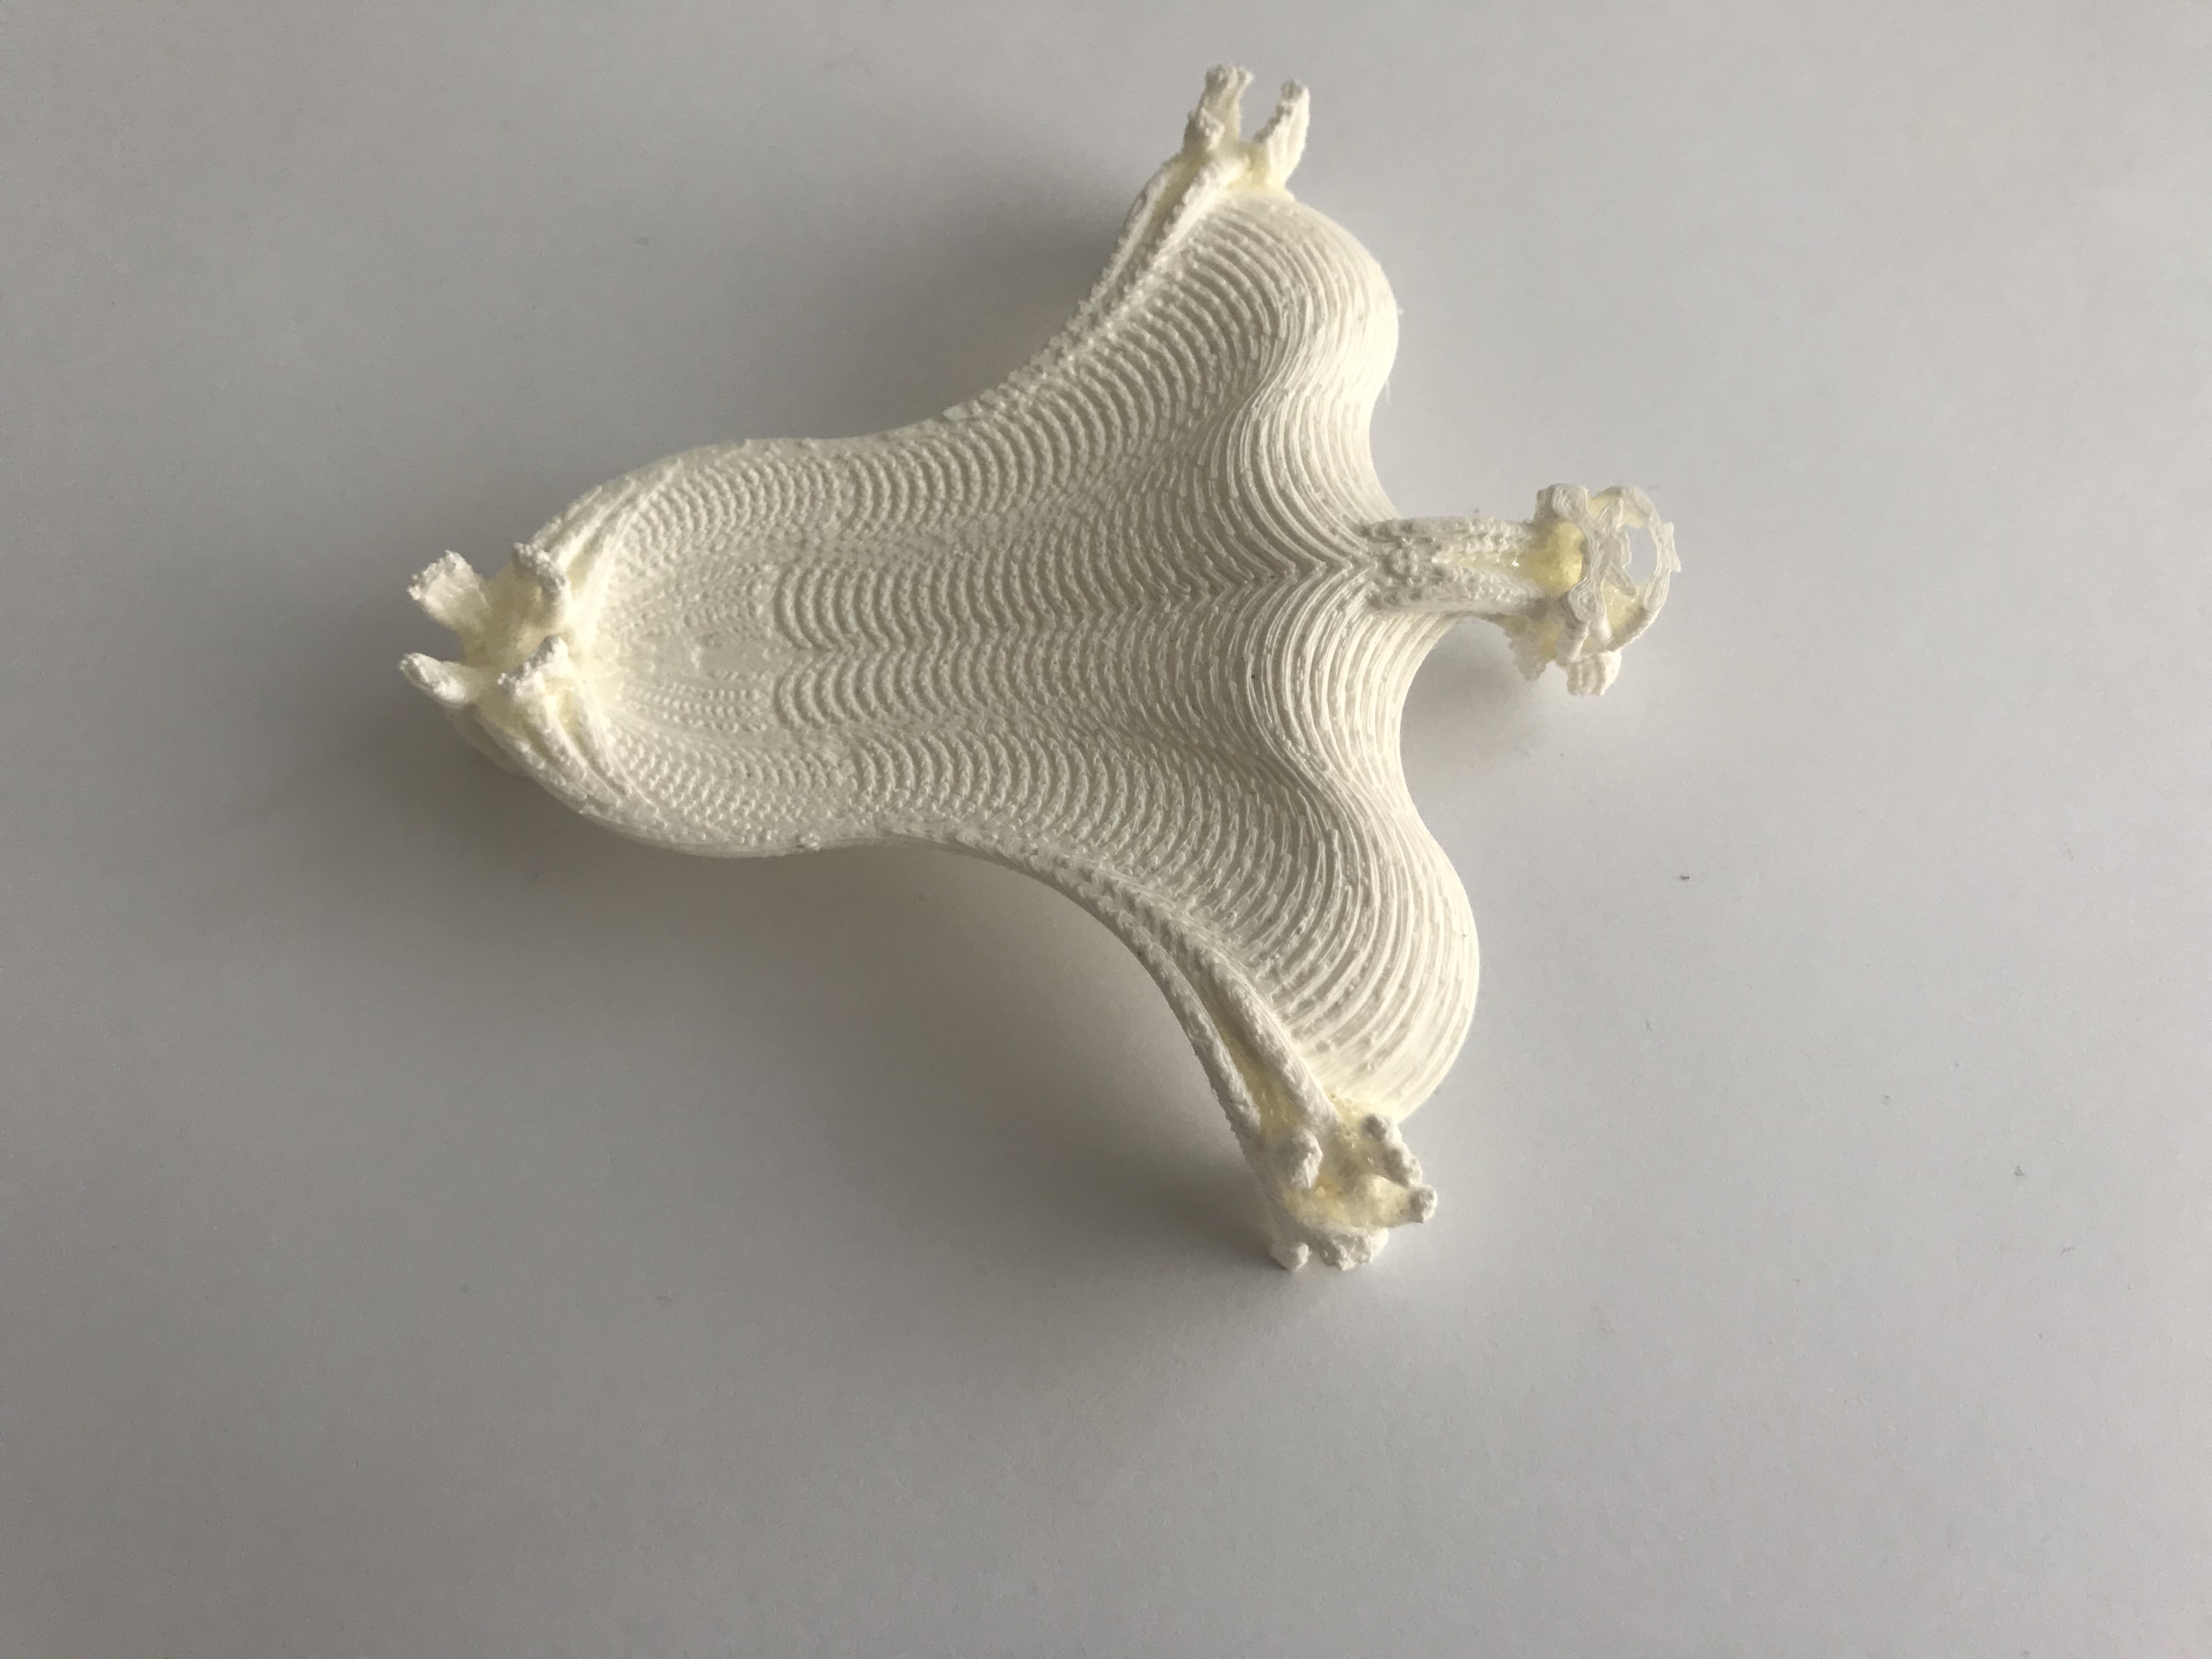
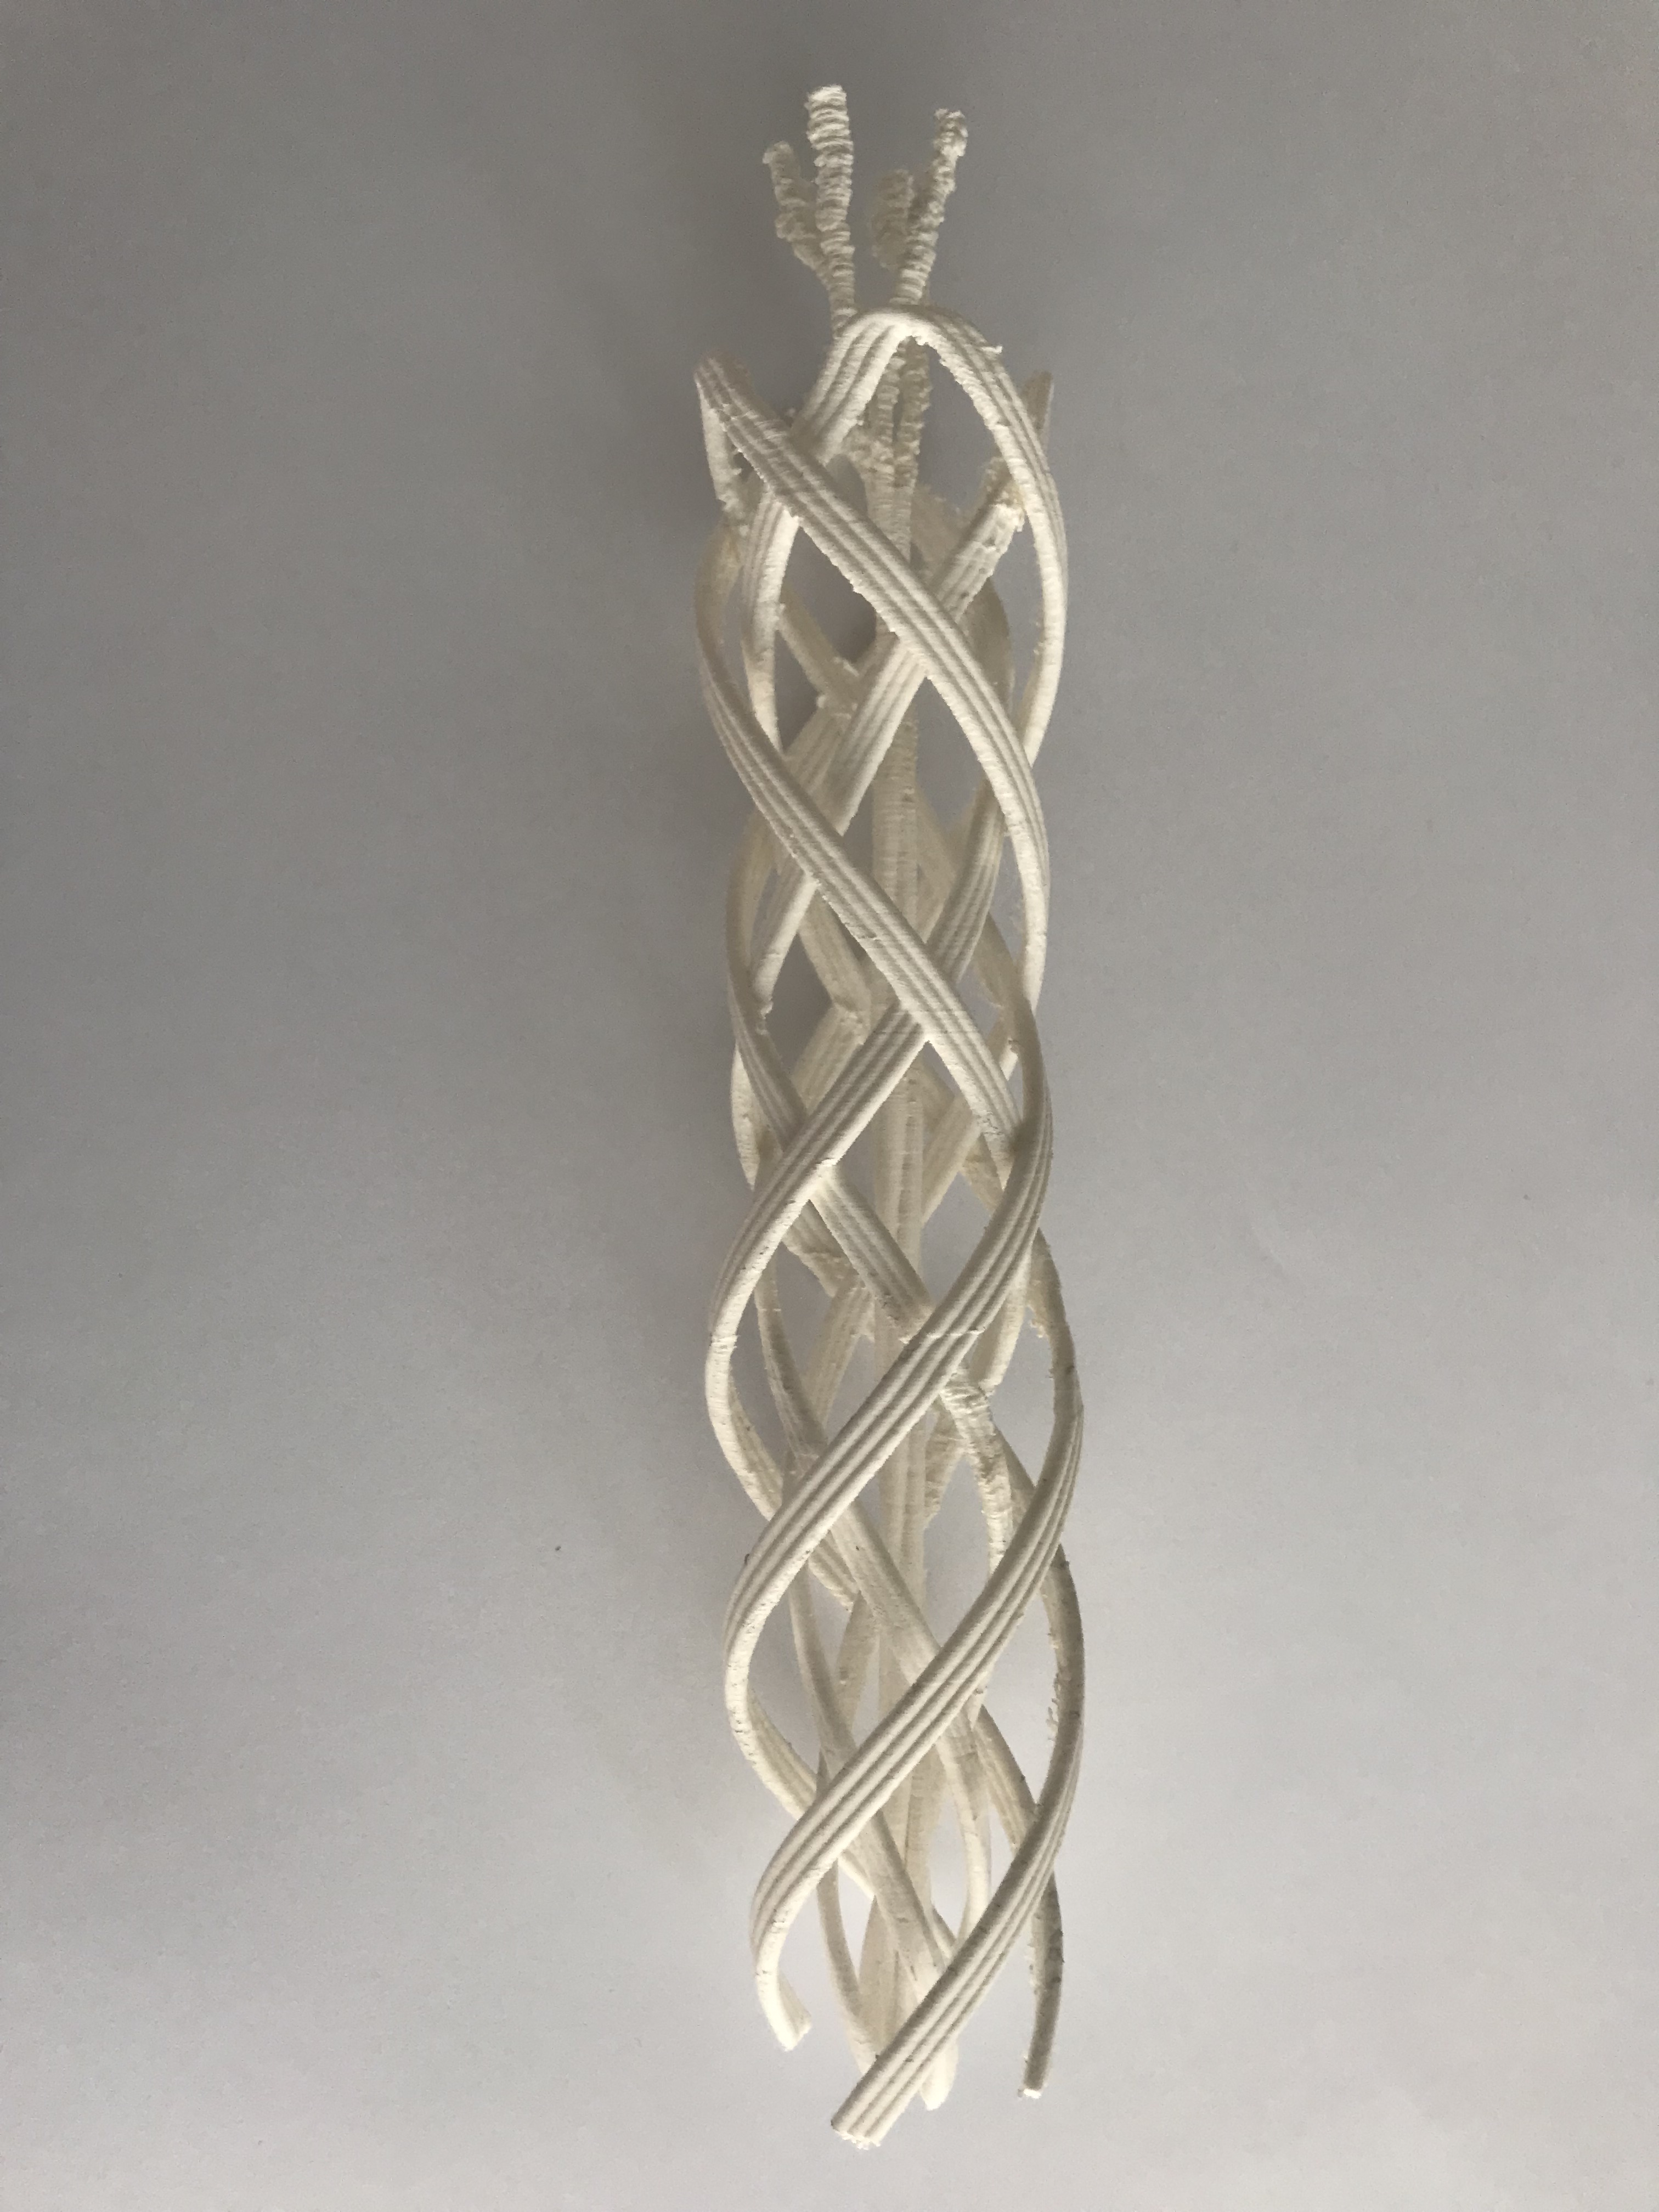
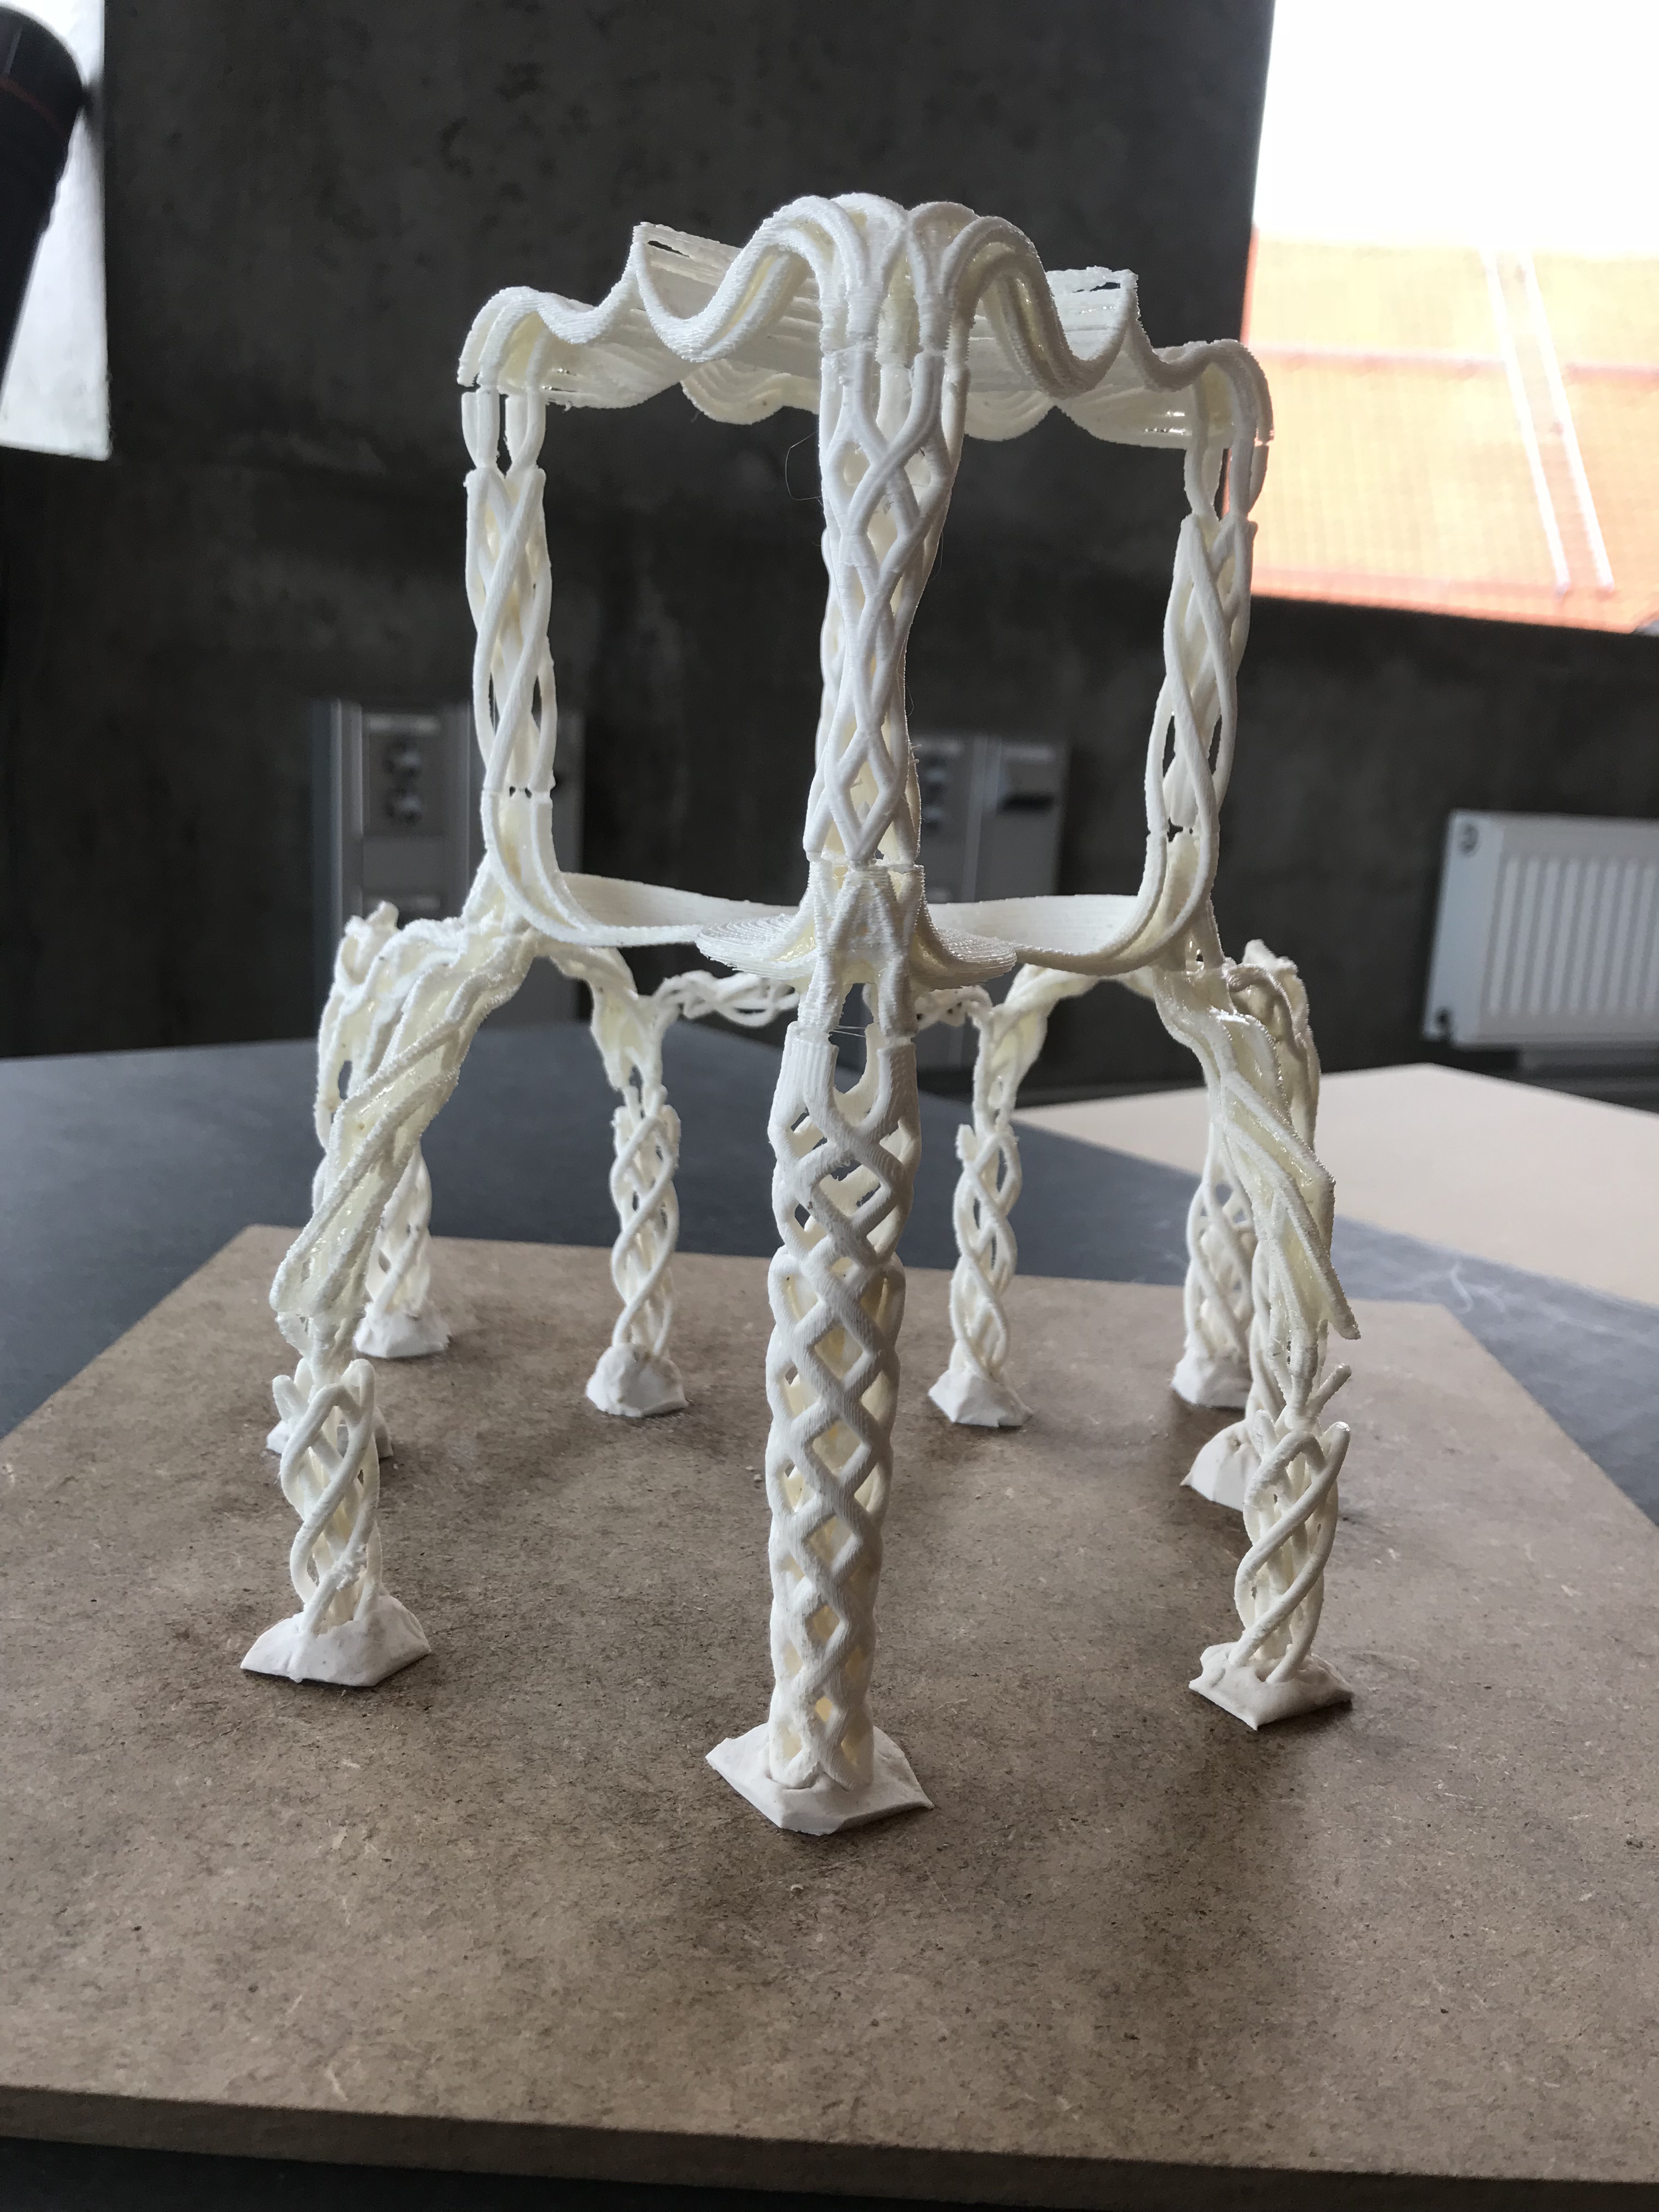
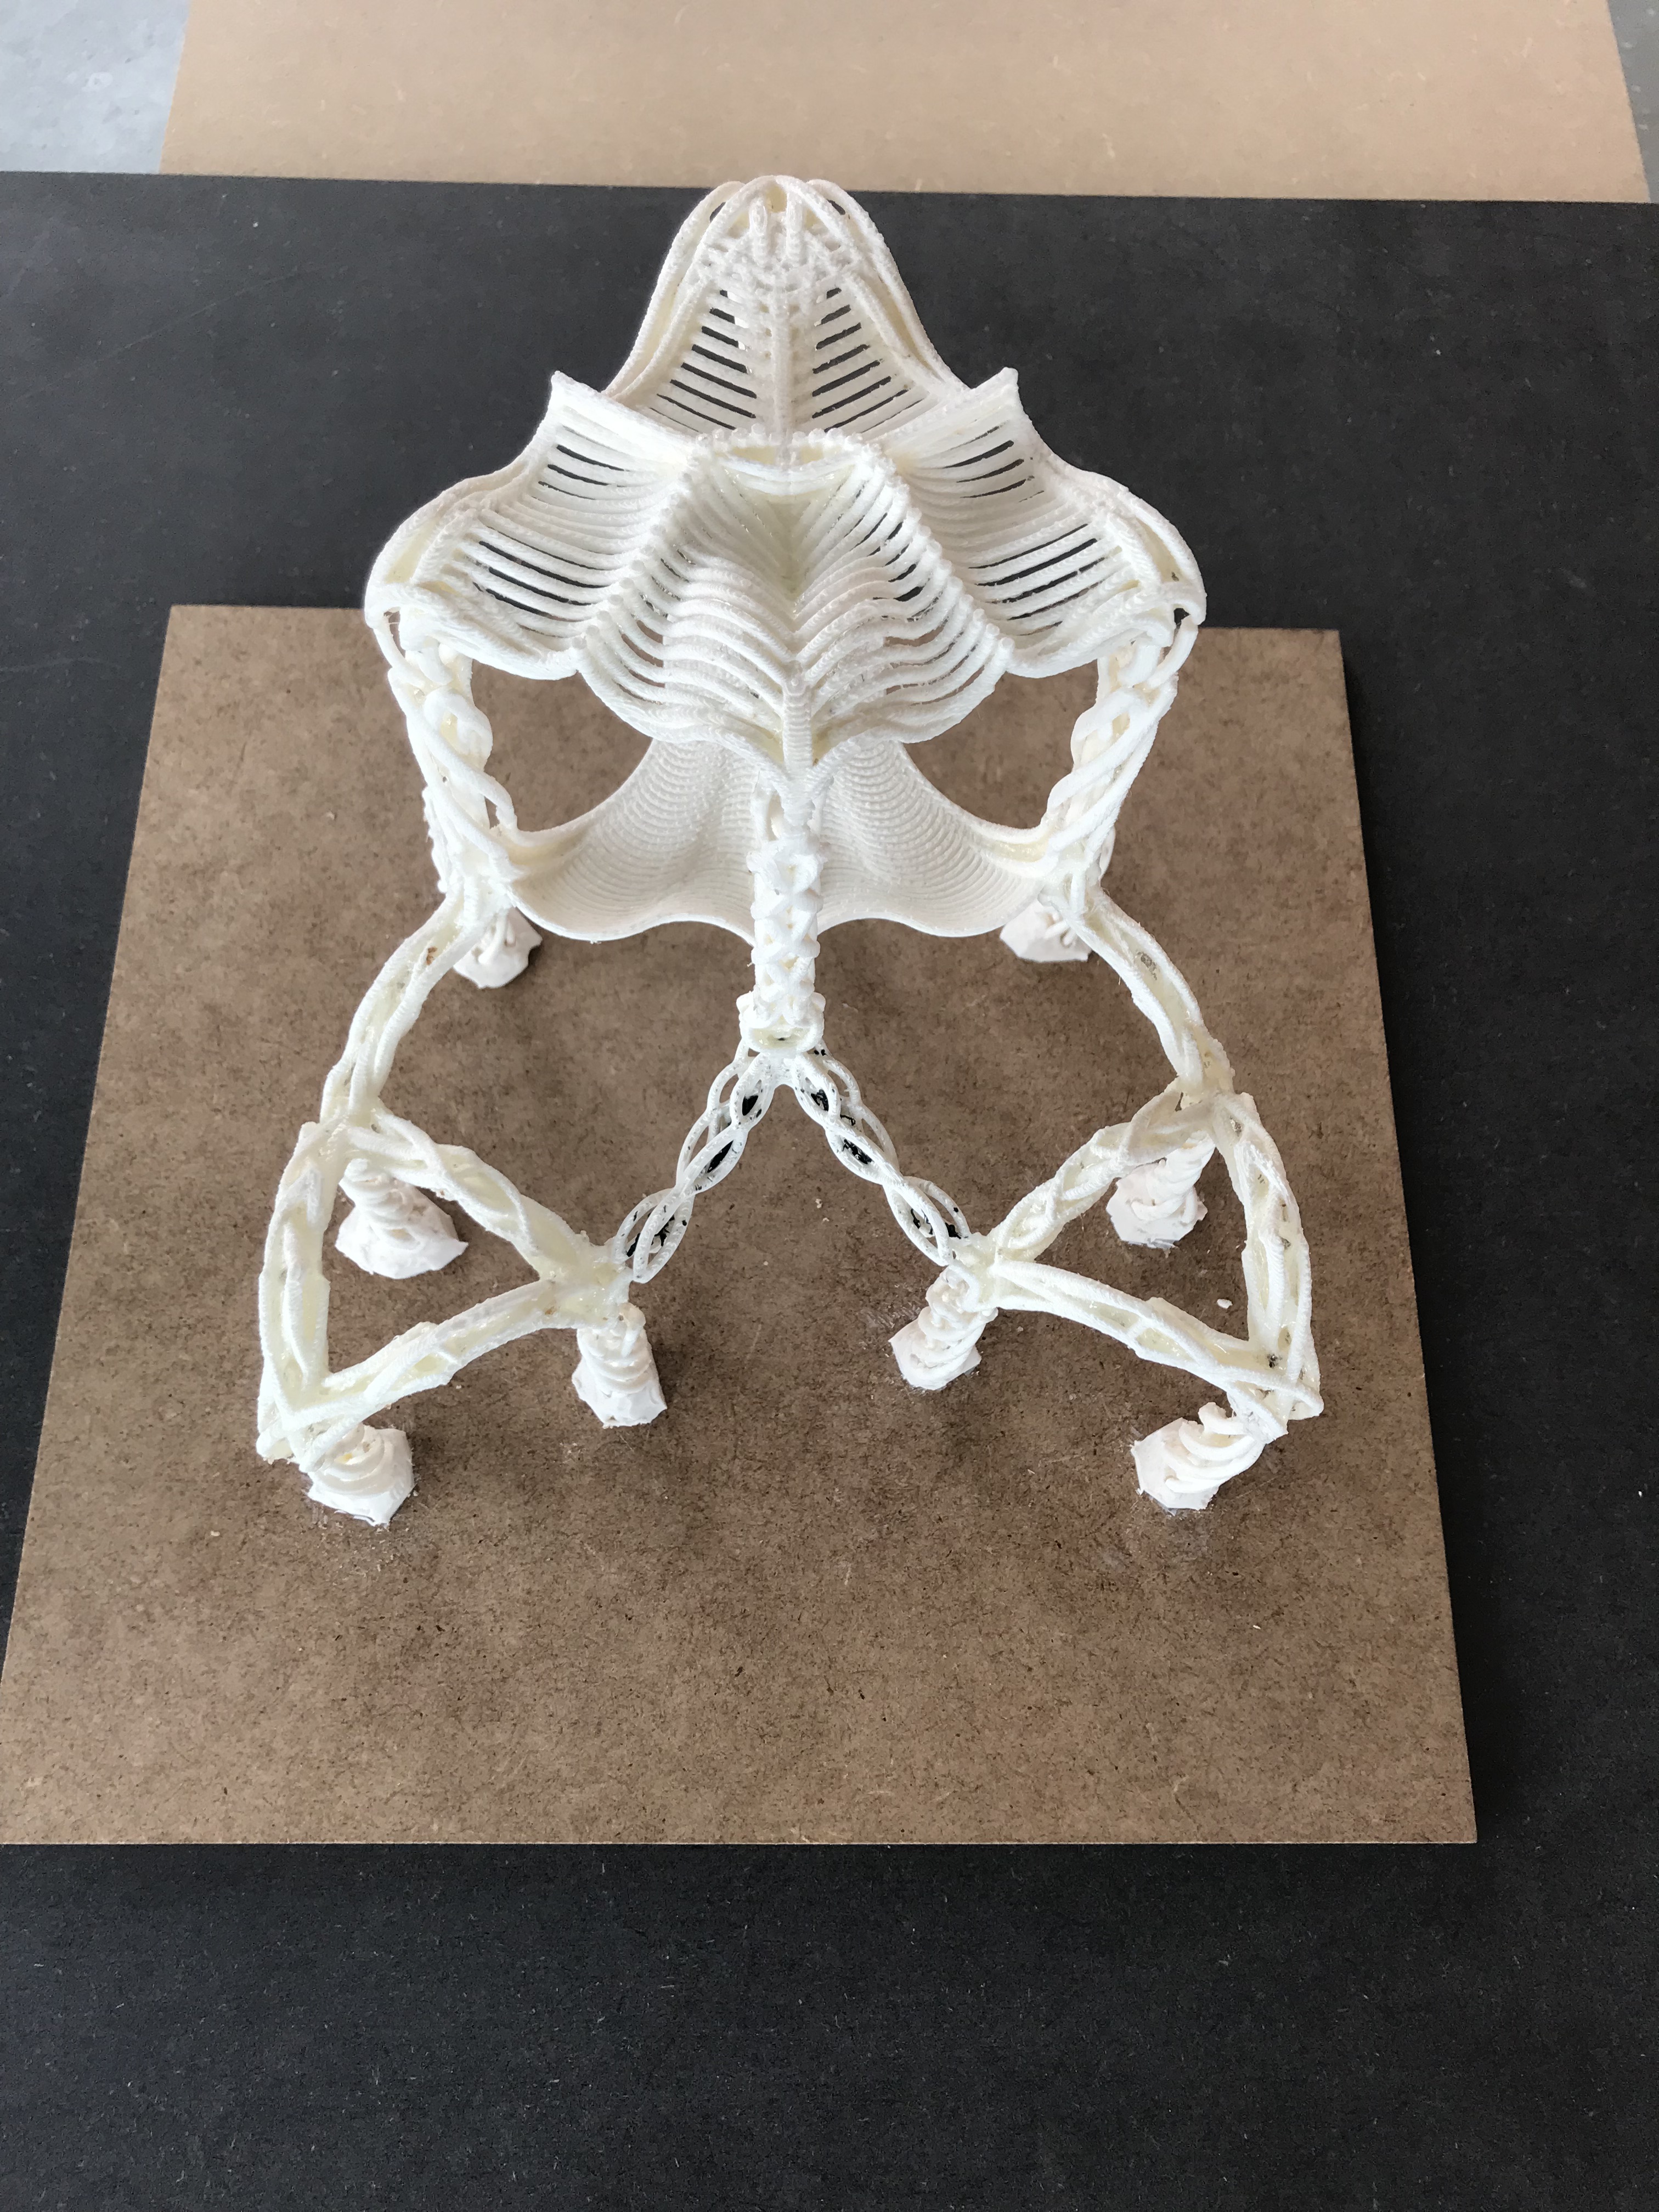
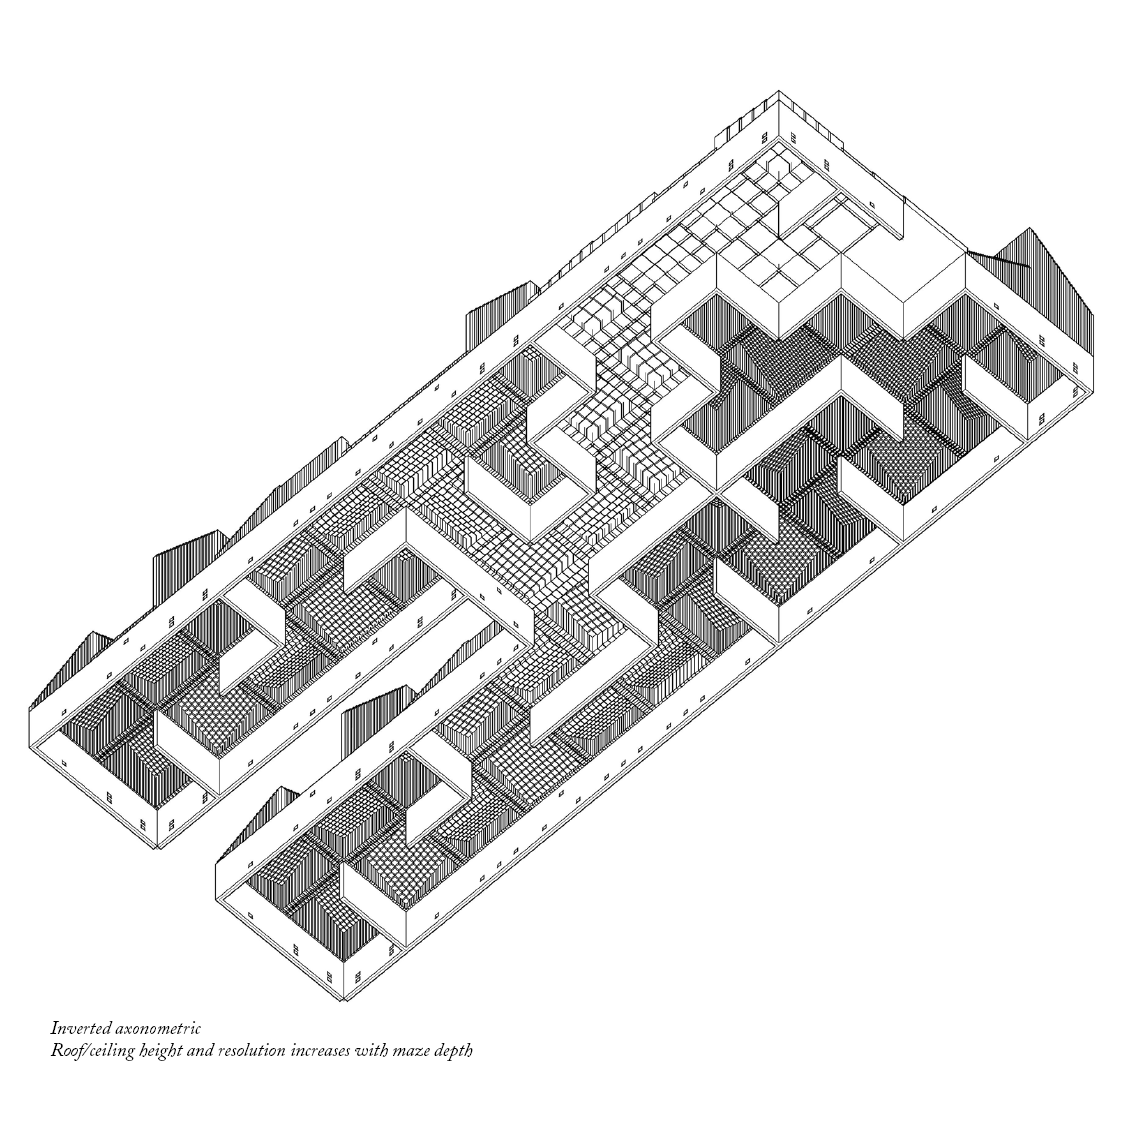
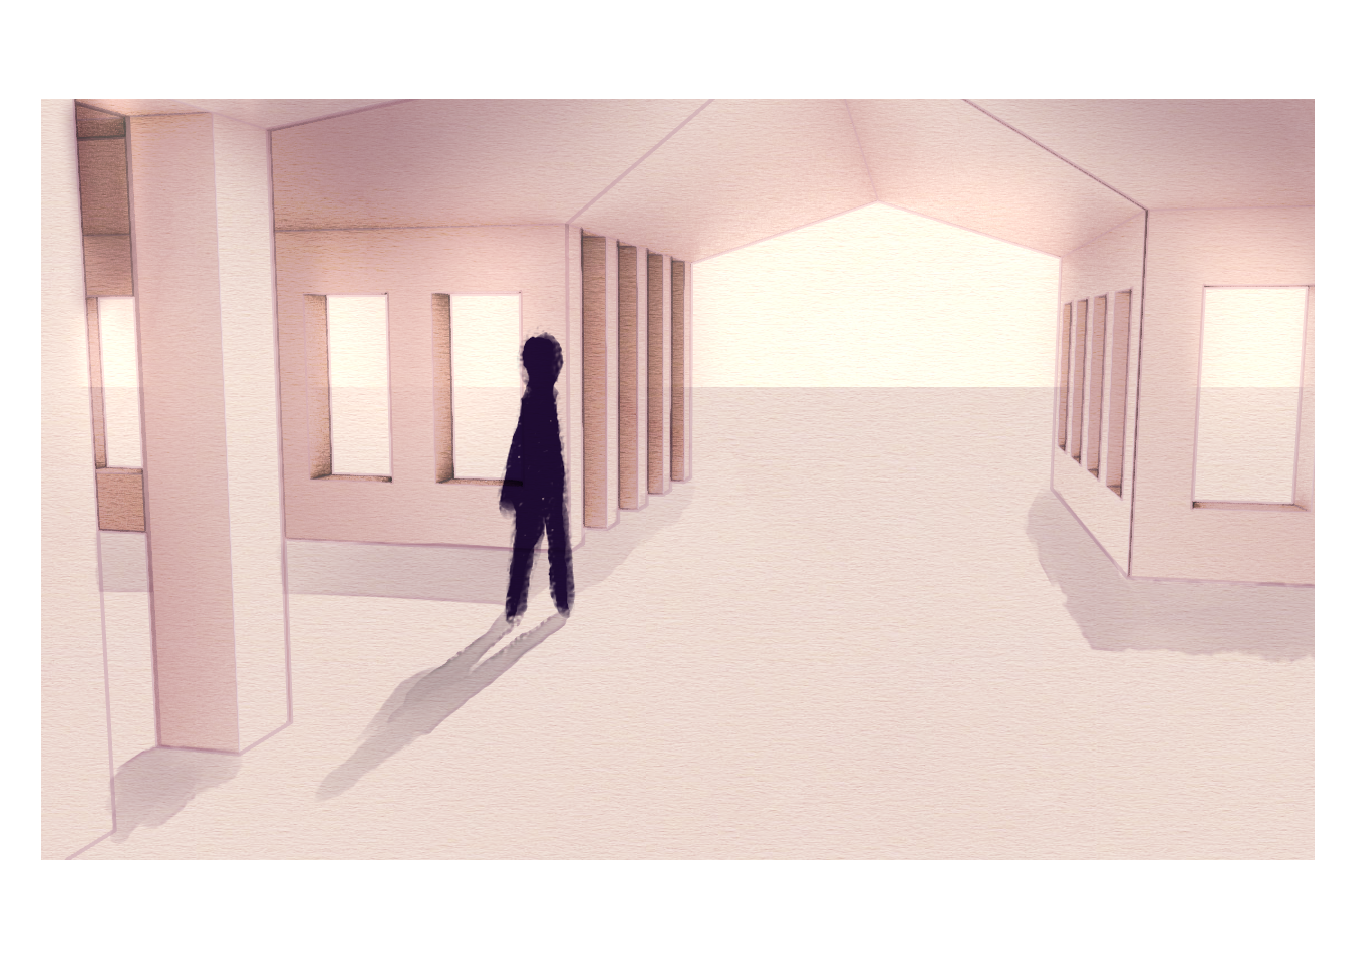
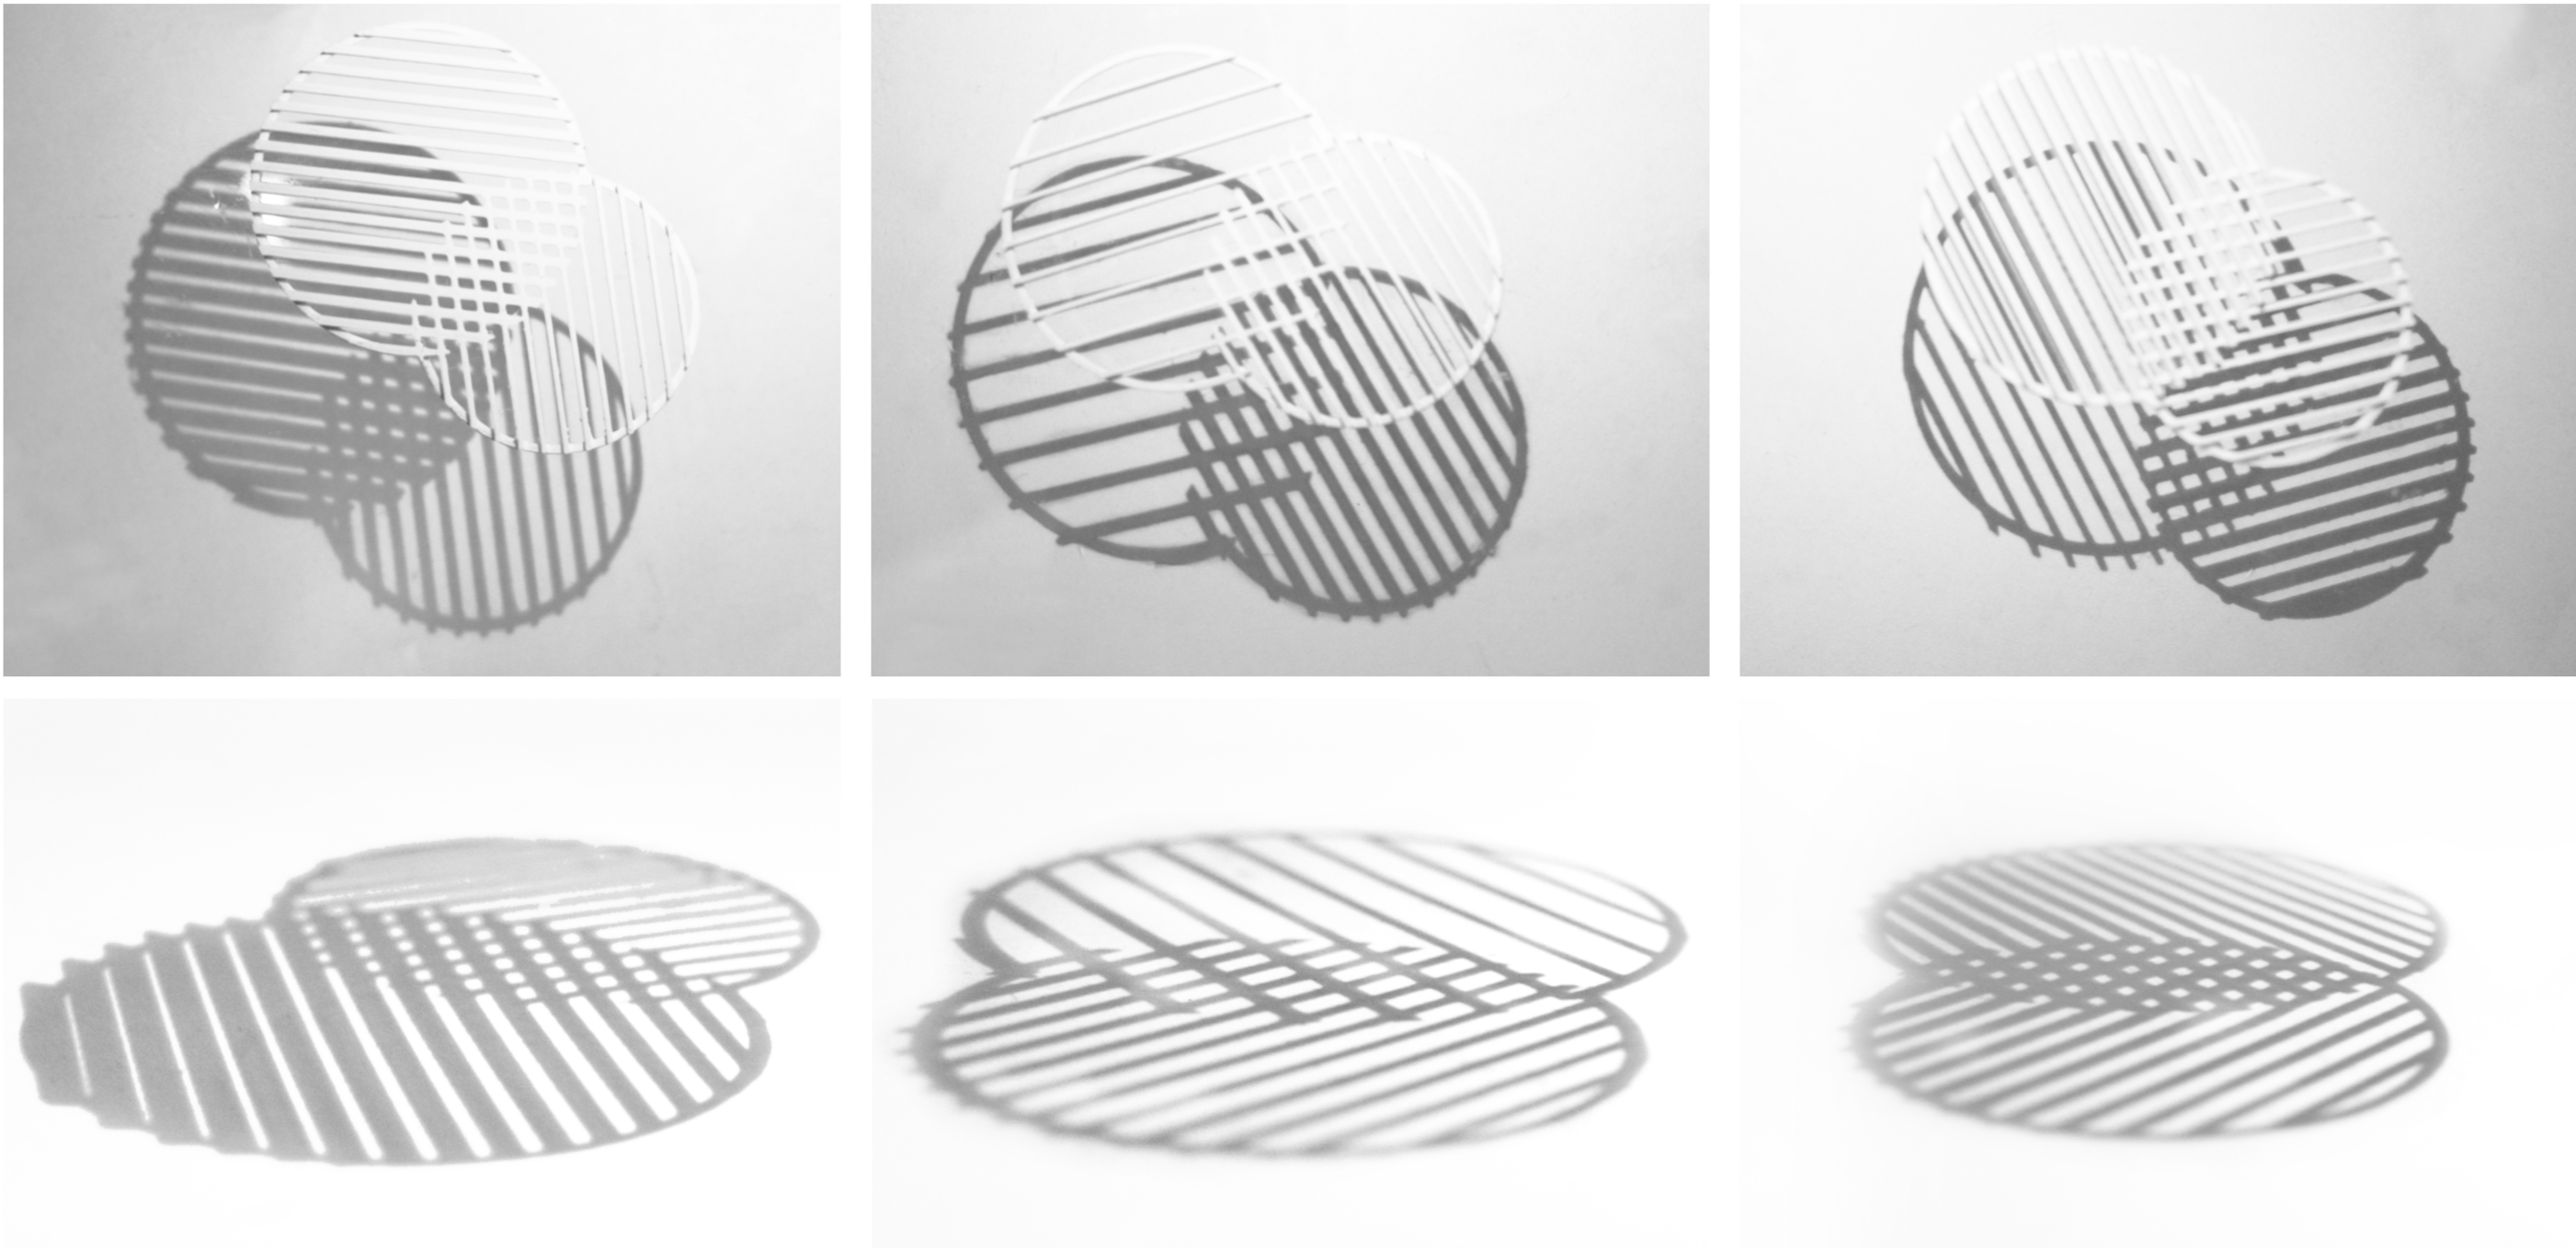
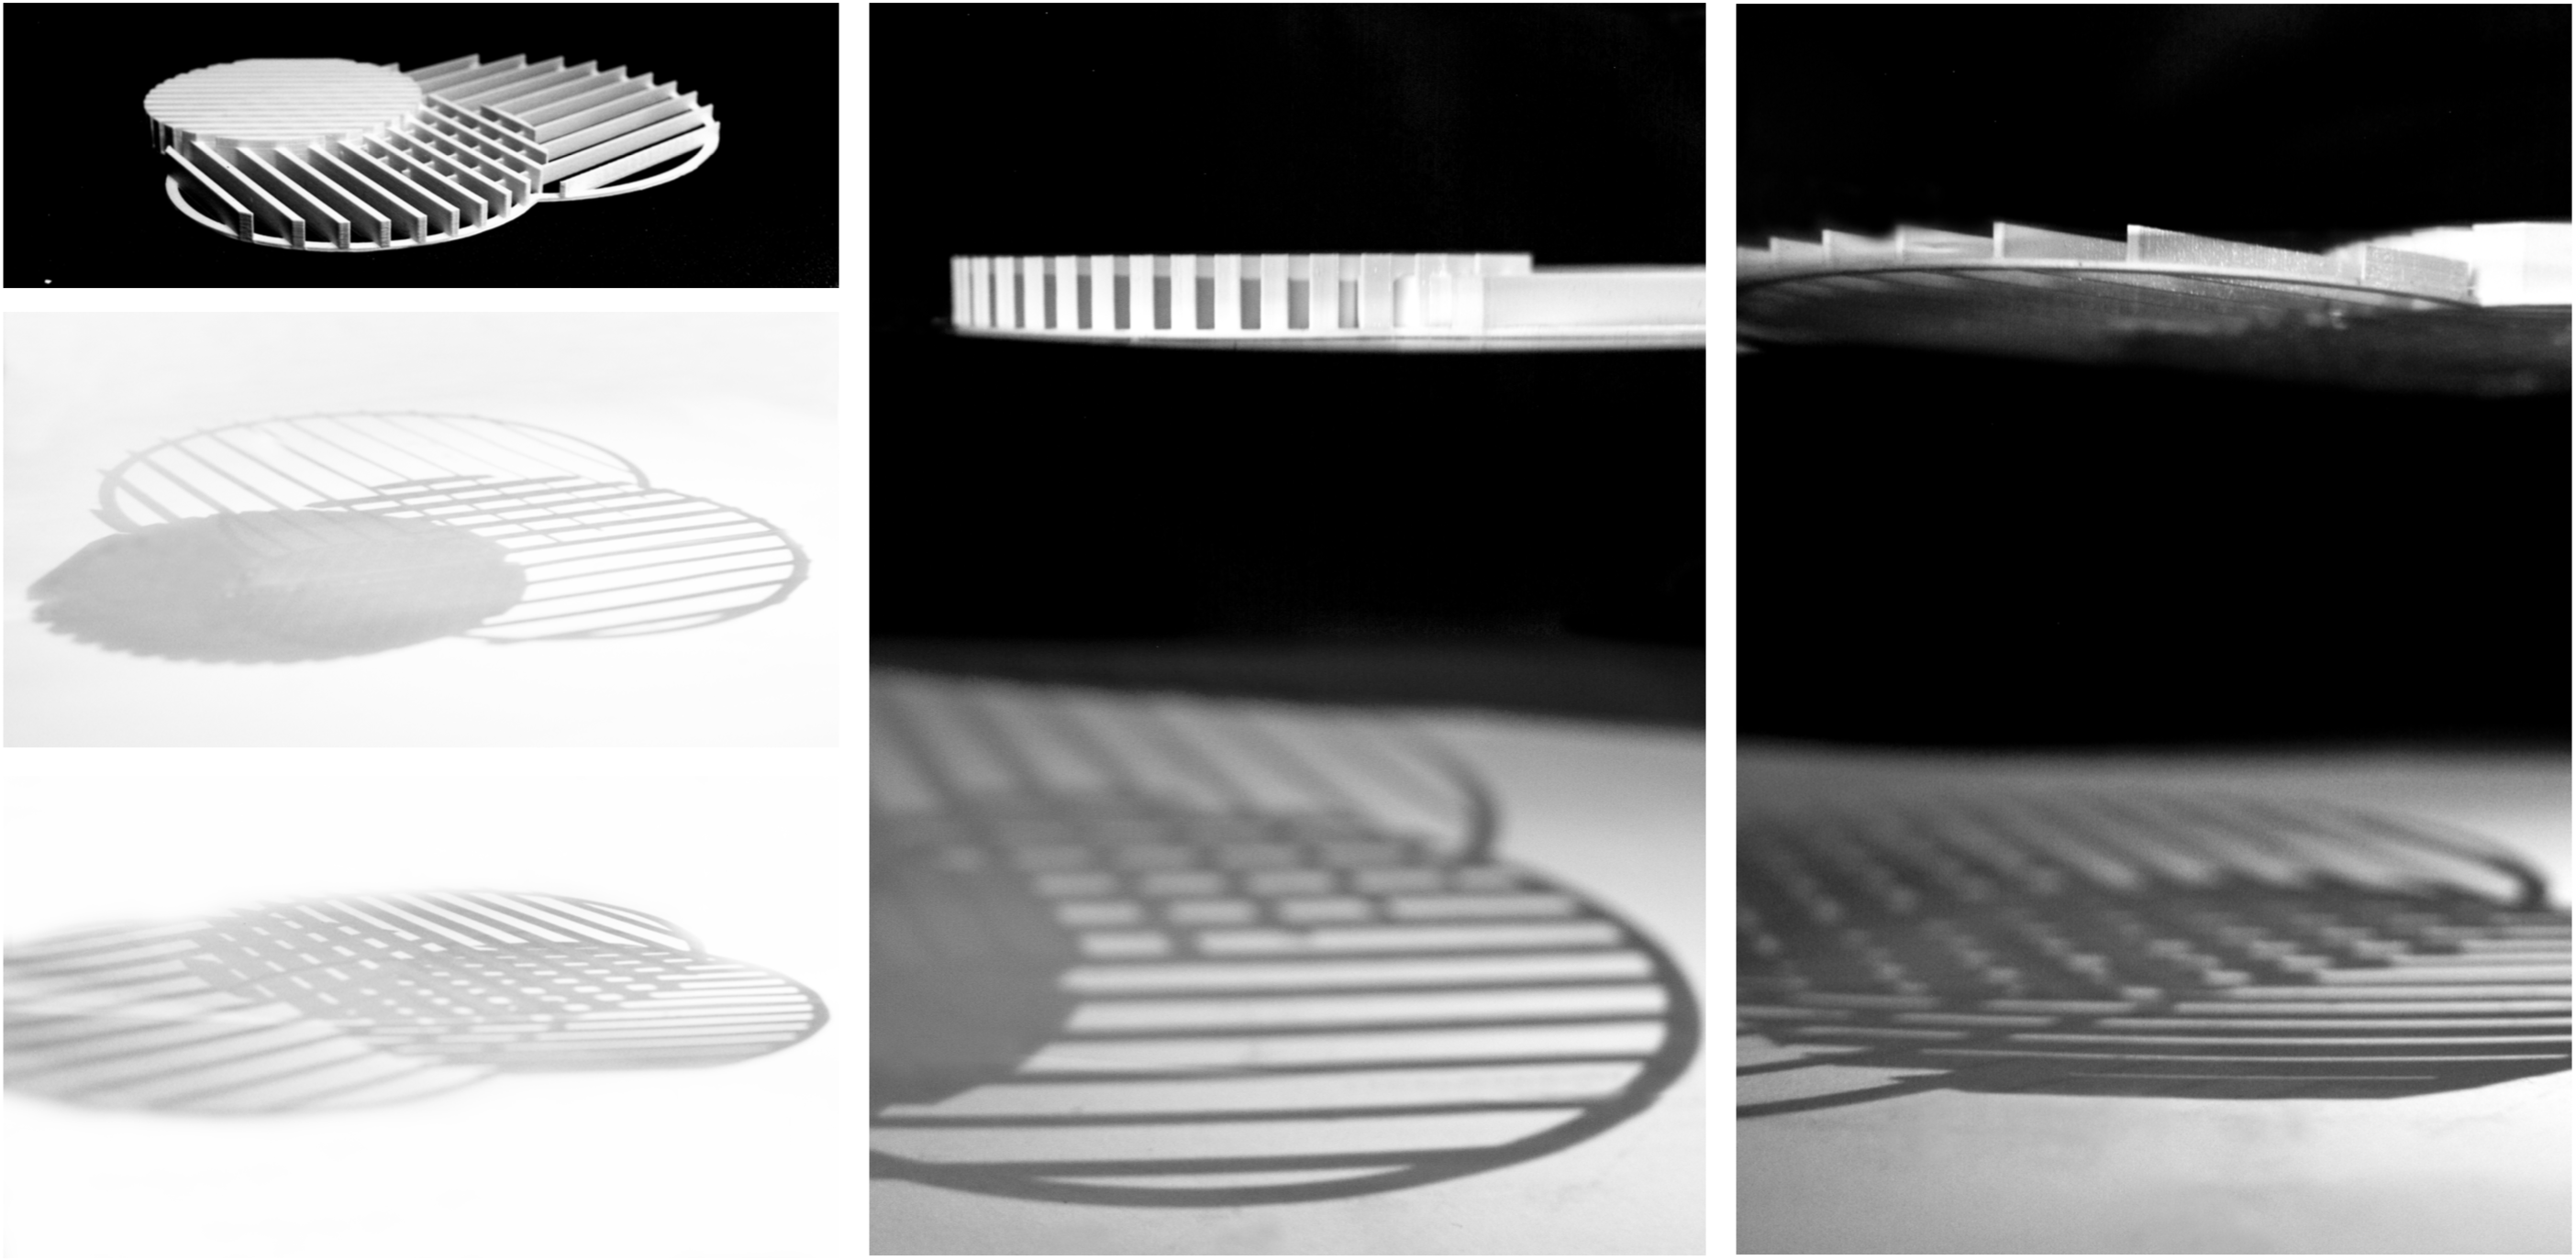
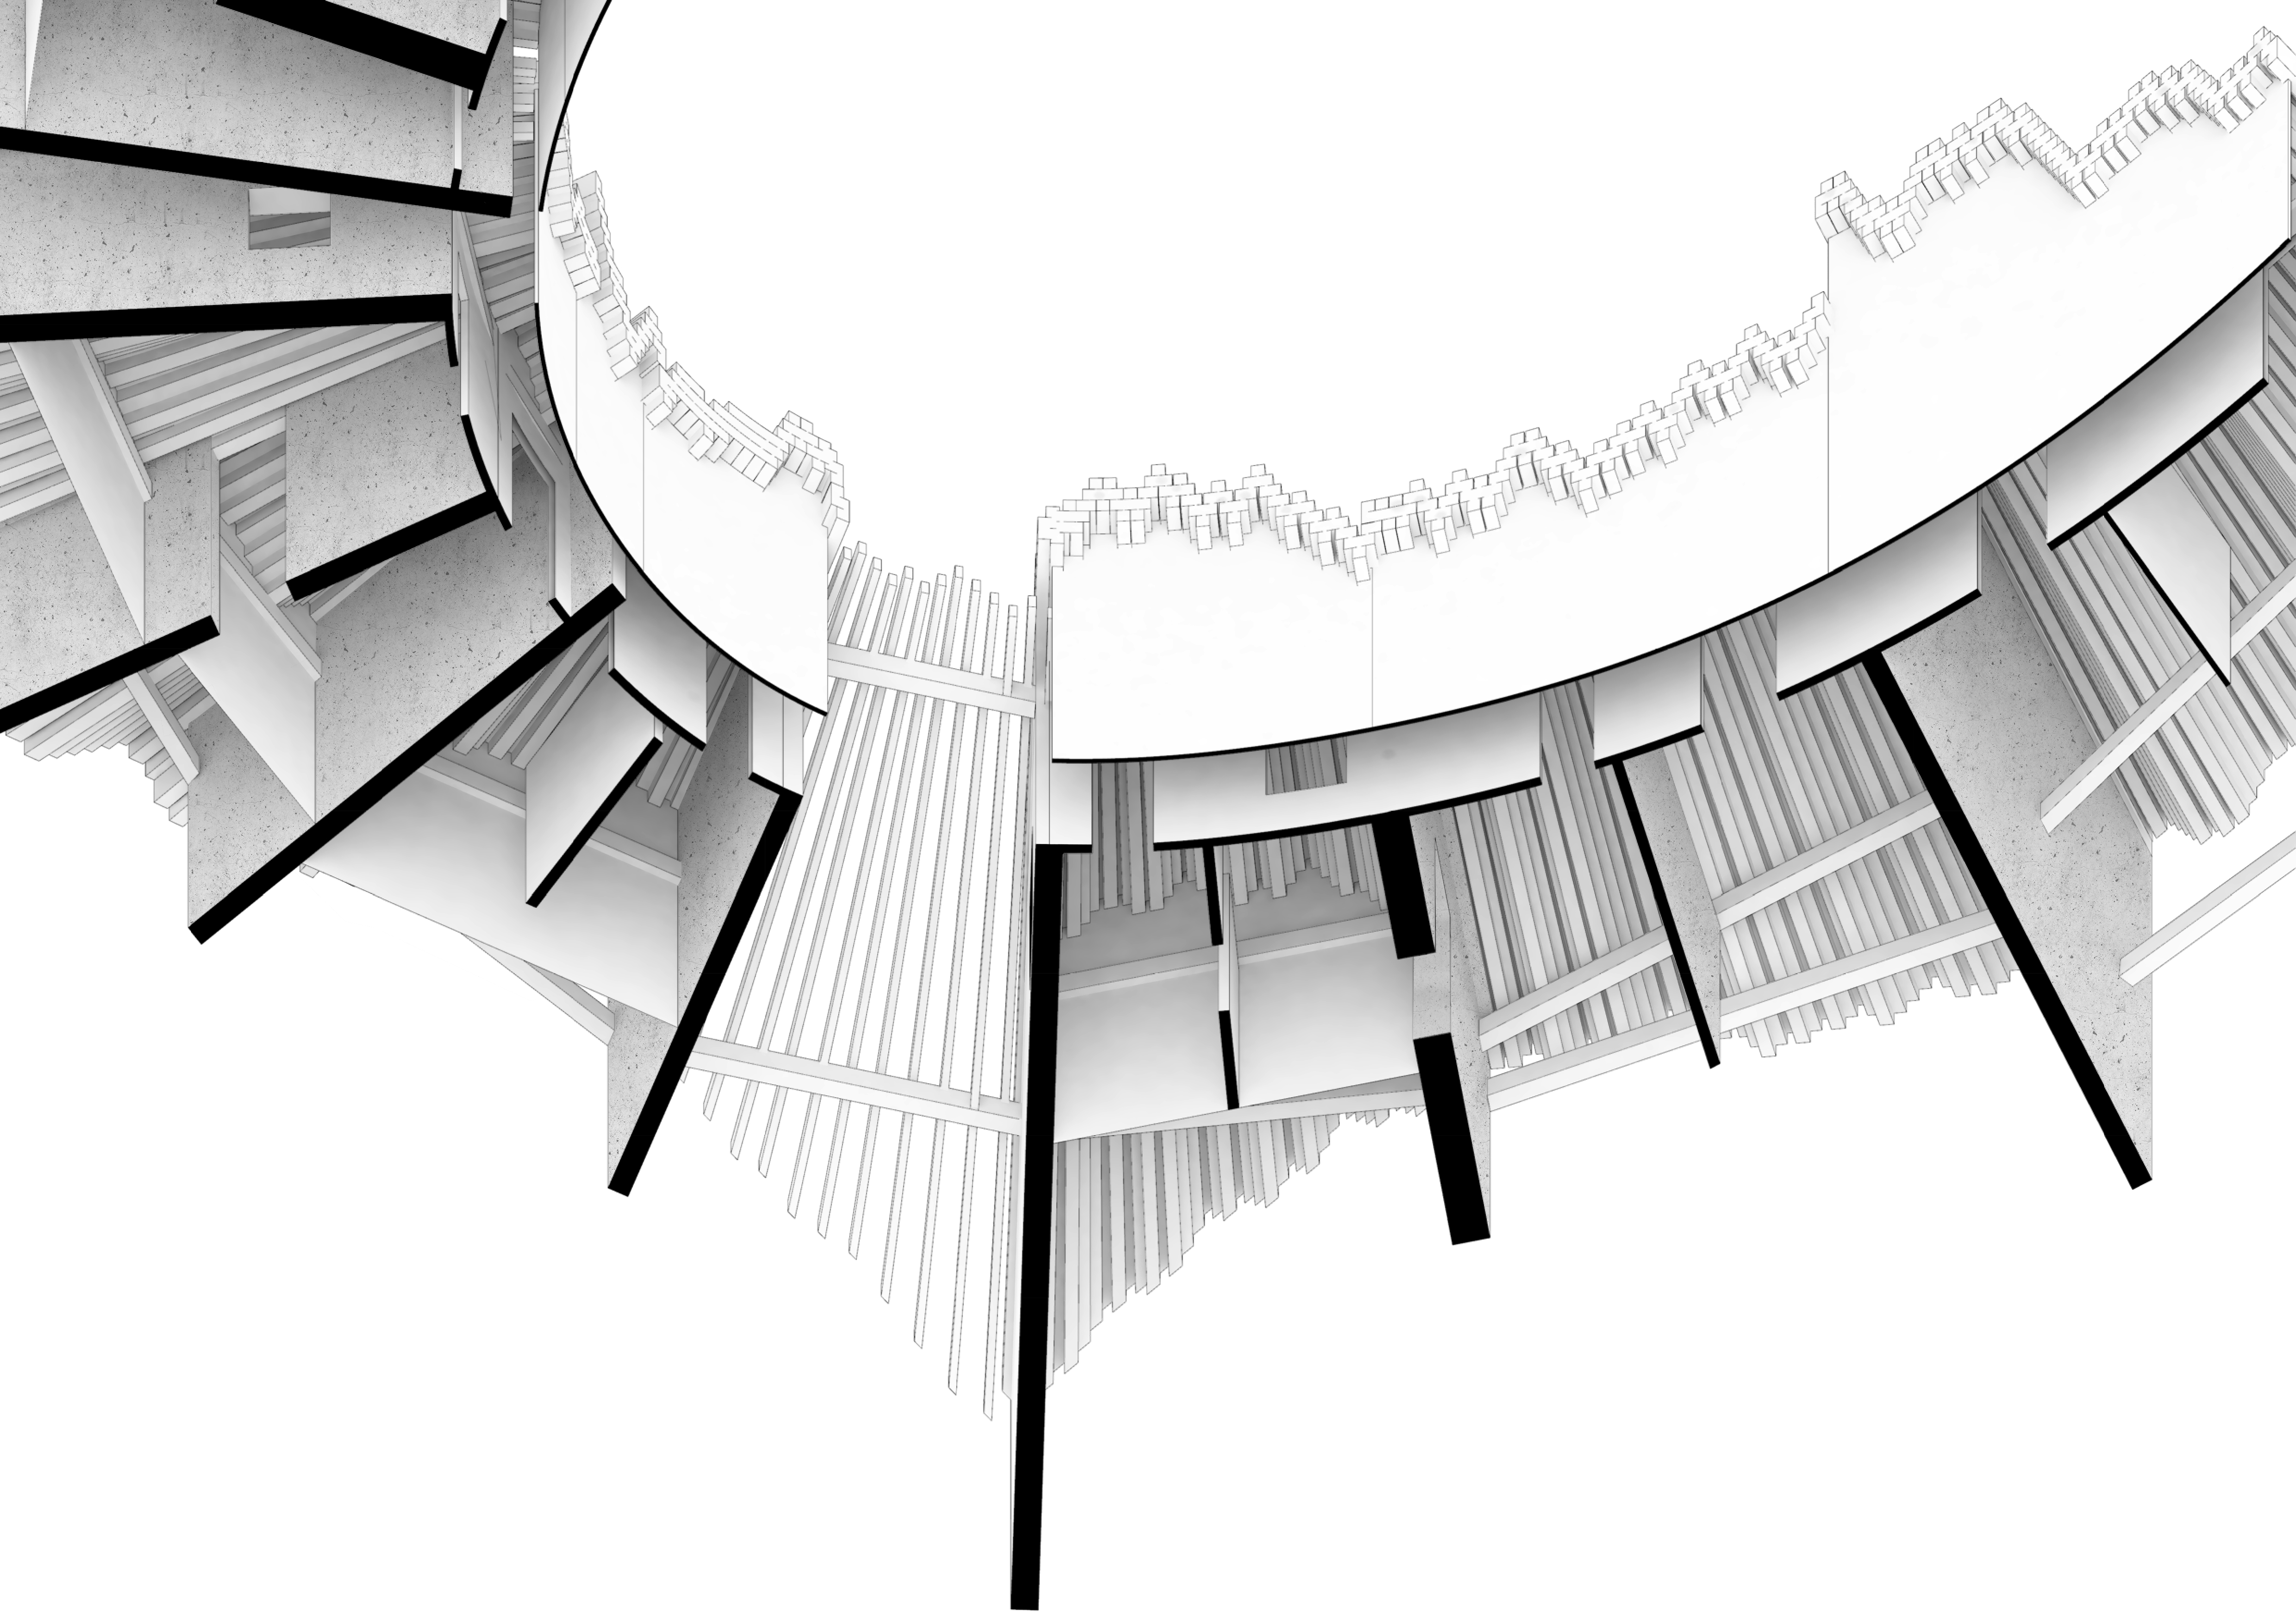
To explore how this form could work tectonically, I built a structural model of the exterior boundary. Using this I hope to explore further how this layer can interact with the internal spaces for the gallery.

DSC_0638DSC_0644DSC_0655DSC_0662

Light and Leading Lines

Looking into the Venn Diagram roof structure, it has several parameters that can be varied. The angle is defined by the direction of the path, however the spacing, thickness and depth of the beams can be varied to achieve a certain level of light, or a certain atmosphere in the space below. By using Grasshopper the parameters can be quickly tested.  

Screen Shot 2018-10-29 at 21.57.47

This set of 3D printed models of the roof system keeps one circle constant while changing one parameter in the other circle. This shows the difference in the shadow effect, and how the appearance of the overlapping area changes. (Scale – 1:200)

Screen Shot 2018-10-29 at 21.57.56

In this model, at a larger scale (1:100), I am investigating a more complex Venn diagram with three intersecting circles. By varying all three parameters in each circle, the different levels of lighting can be observed in the shadows. 

Screen Shot 2018-10-29 at 21.58.14

The paths that generate the spaces provide more opportunity to express themselves. As they travel across the boundary, they can take the form of indoor and outdoor paths, windows, roof structure and ground level features such as steps or seating:

Screen Shot 2018-10-29 at 21.58.26Screen Shot 2018-10-29 at 21.58.42

27 grids later.

Continuing with my experimentation of grids, I have been developing a more complex system which can be used to generate spatial arrangements that respond to specific site conditions and parameters.

Exercise 3 Sheets-4

I have split the building into a primary, secondary, and tertiary layer, each produced through an individual grid which generates different sized shapes.  The 3 overlapping grids are each sub-divided into 9 regions, which can be programmed to determine the probability of a shape being generated in a specific region.

This system means that I can use certain site conditions such as views, orientation & access to instruct the building form.

Exercise 3. Jack Glasspool-6

To convert this into a 3D form, I continued to use the layers generated through the 2D grid. For the primary layer I combined the large shapes to produce an exterior boundary. Extruding this vertically, I offset the boundary at regular intervals and lofted these together to produce a more irregular form. Repeating this with the second layer, I was able to produce interior walls within this boundary, with the final layer used to generate initial circulation openings.

Experimenting with this process on site, I have generated two varying buildings on site which have both been designed using the same parameters.

Example 1:

Exercise 3 Sheets-6

Axonometric View:

Exercise 3. Jack Glasspool-10

Example 2:

Exercise 3 Sheets-7

Axonometric View:

Exercise 3. Jack Glasspool-9

Dragons and Curves

Delving further into the world of the dragon curve, I think I should start by sharing the principal behind the code.

The dragon curve is a space filling curve that never crosses itself. It is based on a principal of folding a piece of paper and repeating the folds in the same direction. When you unfold the paper with the angles at 90 degrees, the dragon curve can be formed. The folds can be repeated an infinite number of times, with the curve arcing at a 45 degree angle. Here, I will refer to each repetition as iterations.

Dragon-Curve

I varied the code and set up a table to document the results, ultimately choosing three codes to further in my design for a Konsthall.

Mapping_Configurations

Mapping_Configurations_Choices

In order to progress with the design, I chose the code variation M1 to explore spatially. I used the geometries of the curve to create forms at three different scales as an exploration from street to seat; the impact on the streetscape, the scale of the pillar and it’s possibilities as seating. I wanted to allow the dragon curve to be the prominent expression in the design so I allowed all the internal spaces to flow along the curvatures created, sinking into the ground and back up as a sectional flow through the space. The roof structure is set at 45 degrees in a rigid, linear grid format to contrast and strengthen the curves in the Konsthall. The next step would be to bring the dragon curve into the built environment through models.

Studio_9_Task_03_Minjmaa_Enkhbat


Peculiar forms of perpendiculars

Since the last task, I continued to develop how my code was creating tangents, perpendicular lines and rectangles along any drawn input curve. I became particularly interested in moving the tangents along the created perpendicular and then extending to intersect with the next generated perpendicular line. In some cases the lines could not intersect and I was using this generation to determine what spaces are enclosed or open.

Page 2_Organisation Diagrams cropped.jpg

After exploring different arrangements of spaces, walls and circulation, I started to look at how the plan could be translated to create dynamic spaces through the manipulation of the code, such as randomly generating walls or beams at the perpendicular lines. I also created an undulating and pulsating roof form that increases and reduces in height and length by a tolerance from its neighbour.

Page 1_Process Diagrams.ai

Developing this further I began to use the code to generate different systems within the generated form, which I would run one after the other. Firstly the layout of enclosed and open spaces would be produced along with the main walls. Then the input curve would shatter to allow me to generate partition walls between these spaces. Finally I would then use the code to produce the beams and then the roof structure.

Axo development

The geometry of the input curve I used to generate an example proposal was to place my building within the centre of the site and to arrange the spaces around this curve to maximize the views of the site looking outwards. In return this would create an enclosure within the large exposed site. The generated spaces which did not enclose would be use as a route through the building but also the park to maximise engagement to passerby’s.

Site with building

Below is an example of the one of the many unique generations I could create with the code and with different input curves. I used this drawing to take a snapshot and evaluate how the different systems work together and now I intend to explore the roof form and lighting further to see how it can create different spaces which could display work if different situations.

Final axo